Overseas visitor arrivals - short-term trips
Statistics on international travel movements of persons arriving in Australia for short term trips (less than 1 year). It is the number of international border crossings rather than the number of people.
Key statistics
Overseas visitors arriving in Australia for a short-term trip in July 2019 (trend estimates):
- Increased 0.5% since the previous month to 797,900 trips
- Increased 3.3% since the same month previous year
- Reported China as the largest source country, accounting for 15% of all visitor arrivals.
2.1 Visitor arrivals - Original, Seasonally adjusted and Trend estimates(a)
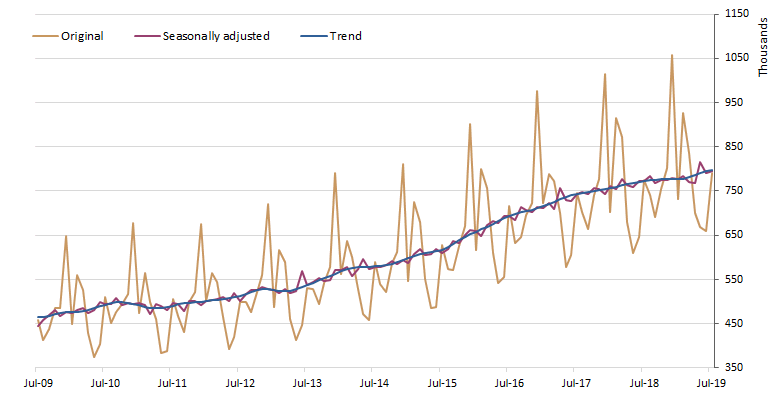
(a) For more information see Explanatory Notes 19-30. For breaks in trend series see Explanatory Note 29.
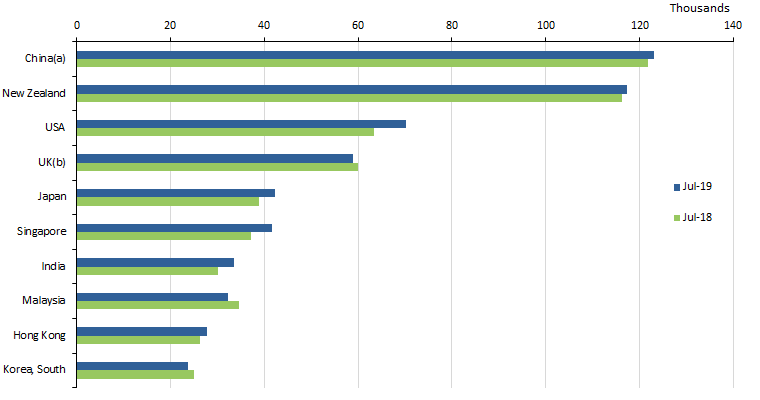
Source countries (trend estimates)
The three leading source countries for visitor arrivals to Australia in July 2019 were:
- China (123,000 trips)
- New Zealand (117,300)
- USA (70,100).
2.2 Visitor arrivals - Top 10 source countries - Trend estimates
 (a) Excludes SARs & Taiwan.
(b) Includes the United Kingdom, Channel Islands and Isle of Man.
(a) Excludes SARs & Taiwan.
(b) Includes the United Kingdom, Channel Islands and Isle of Man.
Among the top ten source countries, the highest annual increases were recorded for:
- Singapore (12.6%)
- India (11.4%)
- USA (10.7%).
The highest annual decreases were recorded for:
- Malaysia (-6.9%)
- Korea, South (-5.2%)
- UK (-1.7%).
2.3 Visitor arrivals - Top 10 source countries(a) - Monthly and annual change |
|
 | Trend | Seasonally adjusted | Original | Jun '19 to Jul '19 | Jul '18 to Jul '19 |
| Country of Residence | '000 | '000 | '000 | % change - trend | % change -trend |
|
| China(b) | 123.0 | 122.3 | 150.4 | 0.9 | 1.0 |
| New Zealand | 117.3 | 116.9 | 133.6 | -0.4 | 1.0 |
| USA | 70.1 | 69.5 | 61.5 | 0.0 | 10.7 |
| UK(c) | 58.9 | 58.6 | 39.3 | -0.5 | -1.7 |
| Japan | 42.3 | 41.8 | 43.0 | 0.3 | 8.7 |
| Singapore | 41.7 | 41.9 | 34.0 | 1.7 | 12.6 |
| India | 33.5 | 34.2 | 26.0 | 2.0 | 11.4 |
| Malaysia | 32.2 | 33.1 | 29.4 | 1.5 | -6.9 |
| Hong Kong | 27.8 | 27.9 | 31.1 | 1.8 | 5.8 |
| Korea, South | 23.7 | 24.4 | 20.9 | 1.0 | -5.2 |
|
(a) Top 10 source countries based on trend estimates.
(b) Excludes SARs & Taiwan.
(c) Includes the United Kingdom, Channel Islands and Isle of Man. |
State or territory of stay (original estimates)
All travellers are asked their intended address in Australia upon arrival. State or territory of stay statistics are only available from original estimates as seasonally adjusted and trend estimates are only applied to source countries.
For those who visited Australia in July 2019, compared to the same month of the previous year, there was:
- an increase of 11.1% more visitors to Western Australia
- a decrease of 7.8% fewer visitors to the ACT.
2.4 Visitor arrivals, State or territory of stay - Annual change to July 2019 (original estimates) | |
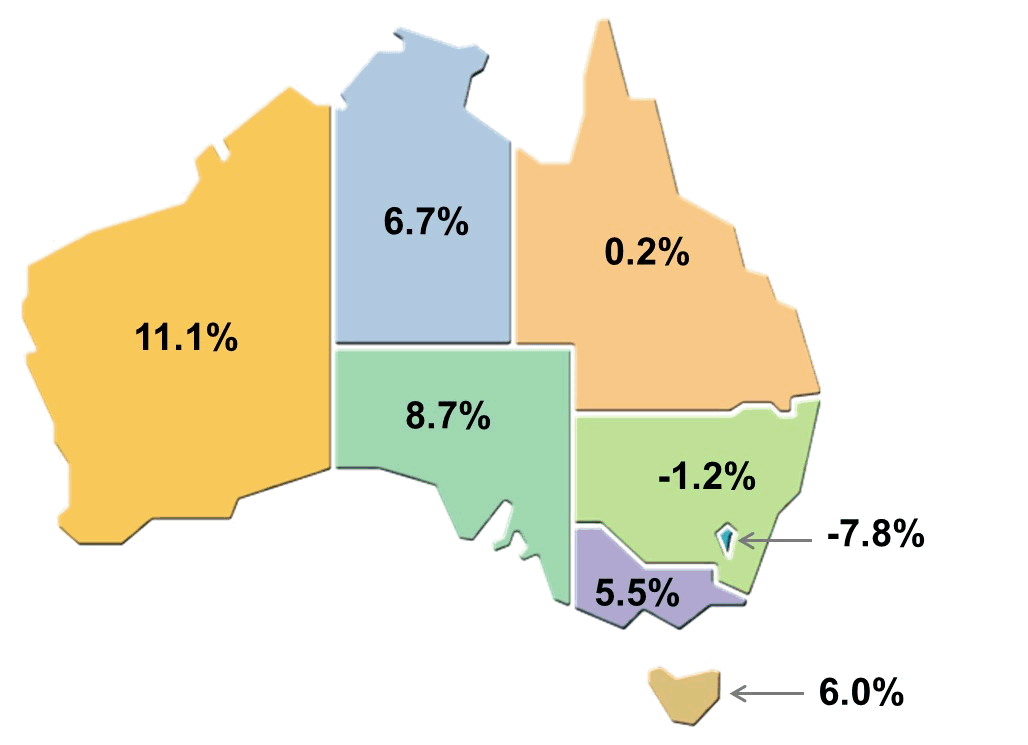 | |
2.5 Visitor arrivals, State or territory of stay(a) - Annual change to July 2019 (original estimates)
|
| Jul '18 | Jul '19 | Jul '18 to Jul '19 |
| State or territory of stay | '000 | '000 | % change - original |
|
| NSW | 271.2 | 268.1 | -1.2 |
| Vic. | 191.4 | 201.9 | 5.5 |
| Qld | 206.5 | 206.9 | 0.2 |
| SA | 20.2 | 22.0 | 8.7 |
| WA | 58.8 | 65.3 | 11.1 |
| Tas. | 5.4 | 5.7 | 6.0 |
| NT | 8.9 | 9.5 | 6.7 |
| ACT | 12.1 | 11.1 | -7.8 |
| Australia(b) | 774.4 | 790.4 | 2.1 |
|
(a) Only available from original estimates.
(b) Includes Other Territories.
 Quality Declaration
  Print Page
 Print All