 SOCIAL TRENDS
POPULATION AND HEALTH
Population characteristics
In June 2006, Western Australia's estimated resident population was 2.06 million persons. This was an increase of 41,700 persons (2.1%) from June 2005 and 293,800 persons (17%) from June 1996. In percentage terms, Western Australia's population growth of 17% between June 1996 and June 2006 was higher than the national average of 13% and was the 2nd highest among the states and territories behind Queensland with 23% .
In June 2006, the median age (the age at which half the population is older and half is younger) of the Western Australian population was 36.2 years. This is slightly younger than the national median age of 36.6 years. The median age of the Western Australian population increased from 33.1 years in 1996.
The ratio of males to females aged 0-64 years was similar in both 1996 and 2006 (104.0 and 104.5 males per 100 females respectively). However, for those aged 65 years and over, the ratio increased from 79.2 to 84.9 males per 100 females over the same ten year period. In 2005, life expectancy at birth was 83.8 years for females and 78.8 years for males in Western Australia. Between 1996 and 2005, the difference in life expectancy between males and females fell from 5.9 to 5.0 years.
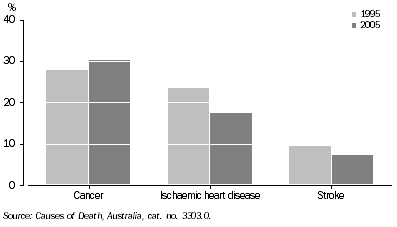
Causes of death
In 2005, there were 11,300 deaths registered in Western Australia. The underlying causes of death were mainly cancer (malignant neoplasms), ischaemic heart disease and stroke - together accounting for more than half (55%) of all deaths. Cancer was the leading underlying cause of 3,400 deaths (30% of all deaths). Of those deaths, 21% (720) were caused by cancers of the trachea, bronchus and lungs. From 1995 to 2005, the proportion of deaths caused by cancer increased from 28% to 30%. Ischaemic heart disease accounted for 18% (2,000) of deaths in 2005, a decrease from 23% of deaths in 1995. Stroke accounted for 7.4% (840) of deaths in 2005, slightly lower than in 1995 (9.6%).
LEADING CAUSES OF DEATH, Proportion of total deaths - Western Australia
In 2005, the leading cause of death for persons aged 15-24 years in Western Australia was transport accidents, accounting for 35% (50 deaths) of deaths in this age group. The proportion was higher for males than females (36% compared to 32% respectively). Suicide accounted for 19% of deaths in the 15-24 year age group, a much higher proportion of males than females (23% compared to 7.9% respectively).
 Print Page
 Print All