|
|
Drivers of Perth's rising prices
INTRODUCTION
Over the past two years, Perth's Consumer Price Index (CPI) has grown by 9.1%, much faster than in Melbourne (6.6%), Sydney (6.8%), Brisbane (7.3%) and the 7.1% growth recorded nationally. The stronger CPI growth in Perth has mainly been the result of escalating housing costs and the lag in Perth's housing cycle behind the 2002-03 boom in the eastern states.
CONSUMER PRICE INDEX (ALL GROUPS)
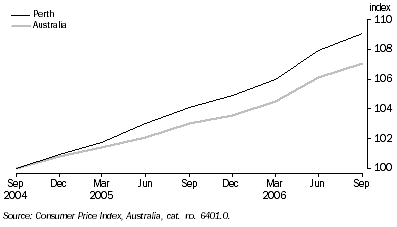
After housing costs, Perth's CPI growth was largely driven by price shocks on fruit and fuel brought about by adverse weather conditions interstate and abroad, and additionally in the case of fuel, the strong demand from China and India. Strong growth in the state's resources and construction industries has flowed through to other parts of the economy (including households), resulting in rising employment and incomes in the state, which have helped fuel the demand for goods and services in Western Australia. Rising business costs have also contributed to prices growth in Perth, mainly due to higher labour, energy and materials costs.
PERTH'S CPI GROWTH
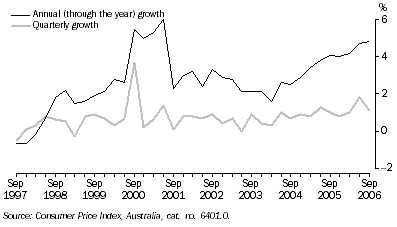
The recent acceleration in Perth's CPI growth began in the September quarter 2004. On average, consumer prices increased by 1.0% per quarter over the two years to the September quarter 2006, and by 4.4% in through the year terms over the same period. Both the quarterly and annual rates of CPI growth were above their 10-year averages of 0.7% and 2.7%, although they remained below their 30-year averages of 1.3% and 5.3%.
The rate of growth in Perth's CPI has been particularly strong over the last year, accelerating from 4.1% to 4.8% between the September quarters of 2005 and 2006 in through the year terms. The latest rise of 4.8% was the largest annual increase recorded since the June quarter 2001 (6.0%).
PERTH'S CPI GROWTH
Perth's through the year growth in CPI has consistently outpaced national CPI growth since the September quarter 2004. Perth's CPI grew by an annual average of 4.4% between the September quarters of 2004 and 2006, compared to 3.5% nationally. The largest difference was recorded in the June quarter 2005, with prices in Perth increasing by 3.8% compared to 2.5% across Australia. This gap of 1.3 percentage points declined to 0.9 percentage points in the September quarter 2006 (4.8% compared to 3.9%).
CONSUMER PRICE INDEX (ALL GROUPS), Change from same quarter of previous year
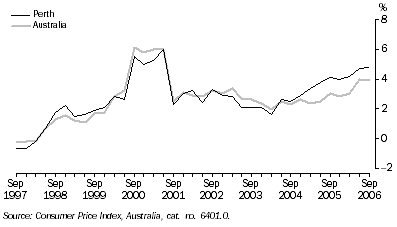
In contrast to Perth, annual CPI growth in other Australian capital cities has closely tracked the national average of 3.5% over the last two years. Since the September quarter 2004, Perth's average annual CPI growth of 4.4% was markedly higher than in Darwin (3.8%), Brisbane (3.6%), Canberra (3.5%), Hobart (3.4%), Adelaide (3.4%), Sydney (3.3%) and Melbourne (3.2%).
DRIVERS OF PERTH'S CPI GROWTH
Nearly all of the commodity groups making up Perth's CPI have contributed to its growth over the past two years, with the exceptions of Clothing and footwear (down 2.2%) and Communication (down 0.3%). The main driver of CPI growth in Perth has been Housing, which accounted for 41.5% of the total change in Perth's CPI between the September quarters of 2004 and 2006. The next largest contributors were Food (19.8%) and Transportation (16.0%). Nationally, CPI growth was mainly driven by Food (30.3%), followed by Housing (20.5%) and Transportation (20.3%).
CONSUMER PRICE INDEX, By group and selected expenditure class(a) - Change between the September quarters of 2004 and 2006 |
|  |
 |  | PERTH |  | AUSTRALIA |  |
 |  |
|  |
|  |
 |  | Contribution to Change
in All groups CPI | Percentage
change |  | Contribution to Change
in All groups CPI | Percentage
change |  |
| Group and selected expenditure class(a) | % | % |  | % | % |  |
|  |
| Housing | 41.5 | 19.1 |  | 20.5 | 7.3 |  |
 | House purchase | 32.2 | 32.6 |  | 8.9 | 7.7 |  |
 | Rents | 4.0 | 8.4 |  | 4.3 | 5.7 |  |
 | House repairs and maintenance | 2.6 | 11.0 |  | 1.7 | 5.6 |  |
 | Property rates and charges | 1.4 | 11.7 |  | 1.8 | 10.9 |  |
| Food | 19.8 | 11.5 |  | 30.3 | 13.5 |  |
 | Fruit | 7.7 | 76.4 |  | 12.5 | 86.6 |  |
 | Restaurant meals | 2.0 | 11.7 |  | 2.2 | 7.7 |  |
 | Take away and fast foods | 1.9 | 6.8 |  | 2.7 | 6.8 |  |
 | Snacks and confectionery | 1.2 | 10.5 |  | 0.9 | 10.0 |  |
| Transportation | 16.0 | 10.7 |  | 20.3 | 10.7 |  |
 | Automotive fuels | 13.6 | 30.8 |  | 17.0 | 31.7 |  |
 | Motor vehicle repair and servicing | 2.5 | 10.4 |  | 0.9 | 5.4 |  |
| Alcohol and tobacco | 6.9 | 7.8 |  | 7.0 | 6.8 |  |
 | Beer | 3.4 | 11.3 |  | 2.7 | 9.2 |  |
 | Tobacco | 2.6 | 9.0 |  | 3.2 | 9.1 |  |
| Recreation | 4.8 | 3.8 |  | 4.1 | 2.4 |  |
 | Domestic holiday travel and accommodation | 3.3 | 15.5 |  | 3.5 | 10.8 |  |
 | Overseas holiday travel and accommodation | 1.4 | 6.5 |  | 1.0 | 2.6 |  |
 | Other recreational activities | 1.1 | 9.3 |  | 1.1 | 7.9 |  |
| Health | 4.8 | 9.2 |  | 6.7 | 9.8 |  |
 | Hospital and medical services | 2.8 | 9.0 |  | 2.2 | 10.6 |  |
 | Dental services | 1.3 | 14.4 |  | 0.7 | 12.1 |  |
| Household contents and services | 3.1 | 2.7 |  | 4.3 | 3.2 |  |
 | Floor and window coverings | 0.8 | 8.0 |  | 0.3 | 4.6 |  |
| Education | 3.1 | 12.2 |  | 4.4 | 11.4 |  |
 | Secondary education | 1.3 | 14.6 |  | 1.0 | 14.3 |  |
 | Tertiary education | 1.0 | 8.4 |  | 0.4 | 7.8 |  |
| Financial and insurance services(b) | 1.9 | 1.8 |  | 3.4 | 2.5 |  |
 | Other financial services(b) | 2.5 | 6.8 |  | 1.7 | 3.8 |  |
| Communication | -0.3 | -0.5 |  | -0.3 | -0.5 |  |
 | Telecommunication | -0.2 | -0.7 |  | -0.2 | -0.7 |  |
| Clothing and footwear | -2.2 | -5.4 |  | -2.2 | -3.6 |  |
 | Women's outerwear | -1.7 | -15.3 |  | -0.7 | -9.1 |  |
| All groups(c) | 100.0 | 9.1 |  | 100.0 | 7.1 |  |
|  |
| (a) Expenditure classes were selected on the basis of their contribution to change in the All groups index. |
| (b) Change between the September quarters of 2005 and 2006. |
| (c) Includes Miscellaneous items not listed in the table. |
| Consumer Price Index, Australia, cat. no. 6401.0. |
The contribution of Housing (41.5%) to Perth's CPI growth over the past two years has exceeded that of other Australian capital cities. Housing's contribution to CPI growth ranged from 11.7% in Melbourne to 35.3% in Darwin between the September quarters of 2004 and 2006. Housing was the main driver of CPI growth in Darwin (35.3%) and Canberra (24.4%), while Food was the major driver of the CPI increases in Adelaide (34.7%), Sydney (33.8%), Brisbane (31.5%), Melbourne (30.8%) and Hobart (26.5%).
Housing
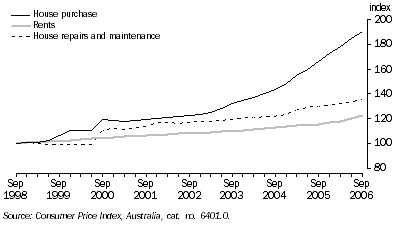
Housing costs in Perth have increased by 19.1% between the September quarters of 2004 and 2006, mainly due to price increases for House purchase, Rents and House repairs and maintenance. House purchase includes the price of new homes (excluding land) and major improvements to existing homes, as well as the cost of fixed appliances such as hot water systems, dishwashers, etc. Over the last two years in Perth, prices associated with House purchase have risen by 32.6%, while Rents and House repairs and maintenance have increased by 8.4% and 11.0% respectively.
CONSUMER PRICE INDEX, Housing - Perth
Food
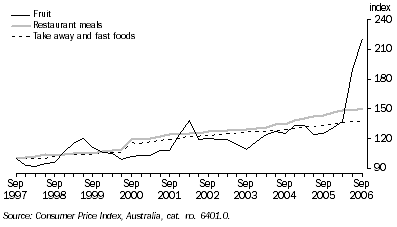
Food prices have risen by 11.5% in Perth between the September quarters of 2004 and 2006, with much of that growth the result of rising Fruit prices (up 76.4%), while significant contributions also came from Restaurant meals and Take away and fast foods. The growth in Fruit prices was directly attributable to the destruction of Queensland's banana crops by Tropical Cyclone Larry in March 2006, which led to a tripling of Australian banana prices in the June quarter 2006 and a further 45.0% rise in the September quarter. Price rises in other foods have been affected by drought conditions across Australia.
CONSUMER PRICE INDEX, Food - Perth
Transportation
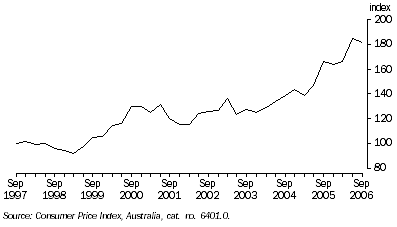
Perth's Transportation prices rose by 10.7% from the September quarter 2004 to the September quarter 2006. Increases in Transportation costs were almost entirely due to rising Automotive fuel prices, which appreciated by 30.8% over the last two years. The price of Automotive fuel rose sharply in the September quarter 2005, due to the effects of Hurricanes Katrina and Rita (USA) on world oil supplies. Subsequent increases have been the result of the ongoing appreciation in world oil prices, driven by strong demand from China and India.
CONSUMER PRICE INDEX, Automotive fuel - Perth
Other drivers of CPI growth
Rising employment and incomes in Western Australia have also added to price pressures in the state. Prices of many market goods and services of a less volatile nature have risen significantly over the last two years, as the demand for those items has increased. The ABS compiles an index of 'Market goods and services excluding volatile items' which removes the impact of non-market goods and services and volatile items on the CPI. Non-market goods and services are those that are less reliant on market forces to set their prices, such as government fees and charges, health services, public transport fares, education, etc. Specifically, the index excludes Fruit and vegetables and Automotive fuel, as well as Utilities, Property rates and charges, Child care, Health, Other motoring charges, Urban transport fares, Postal and Education.
CONSUMER PRICE INDEX, Perth
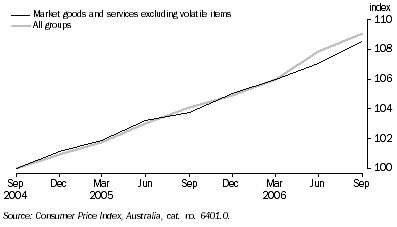
Over the past two years, Perth's CPI of market goods and services excluding volatile items rose by an estimated 8.5% compared to the 9.1% growth recorded in the All groups index. Aside from House purchase, the major items driving the index were:
- Rents, up 8.4%;
- Beer, up 11.3%;
- Domestic holiday travel and accommodation, up 15.5%;
- Tobacco, up 9.0%;
- House repairs and maintenance, up 11.0%;
- Other financial services, up 6.8% from the September quarter 2005 - includes services provided by stockbrokers and real estate agencies, legal and conveyancing fees, and duties levied on relevant transactions;
- Motor vehicle repair and servicing, up 10.4%;
- Restaurant meals, up 11.7%;
- Take away and fast foods, up 6.8%;
- Overseas holiday travel and accommodation, up 6.5%;
- Snacks and confectionery, up 10.5%; and
- Other recreational services, up 9.3% - other recreation and entertainment expenses including admission fees to live events, such as cinema, amusement parks, etc.
|
 Print Page
 Print All