This reissue replaces Main Features released on 28 April. Previous version did not include commentaries relating to small business operators and small business.
NOTES
ABOUT THIS PUBLICATION
This publication presents the results of the Characteristics of Small Business Operators Survey which was conducted in June 2004 as a supplementary topic in the Australian Bureau of Statistics (ABS) monthly Labour Force Survey. This survey of households addressed a number of aspects of the operations of small business as well as identifying the characteristics of small business operators. The survey covers all private sector, non-agricultural small businesses. Similar surveys were previously conducted in February 1995, February 1997, November 1999, June 2001 and June 2003. The ABS plans to conduct an expanded version of the survey in June 2005. Data are presented mainly for the June 2003 and June 2004 surveys. Where it is appropriate to do so, broad comparisons with earlier surveys' results are included in commentary.
RELATED PUBLICATIONS
Other publications which may be of interest are:
- Small Business in Australia, 2001 (cat. no. 1321.0)
- Business Use of Information Technology, 2003-04 (cat. no. 8129.0)
- Australian Industry, 2001-02 and 2002-03 (cat. no. 8155.0)
- Australian Bureau of Statistics Business Register, Counts of Businesses, June 2004 (cat. no. 8161.0.55.001) expected release June 2005
- Experimental Series, Entries and Exits of Business Entities, Australia, 2001-02, 2002-03 and 2003-04 (cat. no. 8160.0), expected release June 2005.
CAUTION ON USE OF ESTIMATES
The counts of businesses and business operators presented in this publication should be used with caution. Their main purpose is to derive proportions of businesses and operators with selected characteristics. They should not be used to determine level, nor growth or decline in the number of small businesses over time because of the sampling error associated with each year's estimate (see paragraphs 23 to 25 of Explanatory Notes). The ABS advises that business-based surveys (as opposed to household surveys) are a better source for small business growth figures (e.g. cat. nos. 8155.0, 8161.0.55.001, 8160.0).
COMPARISONS WITH OTHER ABS DATA
Estimates of the number of businesses operating in Australia can be derived from a number of sources. They may relate to a particular point in time or may be presented as an annual figure. However, these estimates will not always show the same results. Variations will occur because of differing data sources, statistical units, scope and coverage definitions between surveys, as well as variations due to sampling and non-sampling error. These terms are described in the Explanatory Notes.
The estimates of the number of business operators provided in this publication include own account workers (sole proprietors and partners of non-employing businesses); employers (operators of unincorporated employing sole proprietorships and partnerships); as well as working directors of incorporated companies. In other ABS publications, information can be found on numbers of own account workers and employers, but working directors of incorporated companies are generally treated as employees of the business and are not identified as business owners or operators.
Users comparing these results to those of other ABS series, should do so with care, as some other series only relate to employing businesses and do not include details of non-employing businesses.
STATE AND TERRITORY DATA
Care should be taken in the interpretation of estimates for states and territories with relatively small household populations such as Tasmania, the Northern Territory and the Australian Capital Territory. These populations generally have commensurately smaller sample sizes and smaller data estimates. As such, the estimates are generally subject to higher relative standard errors and can lead to the exaggeration of percentage change movements.
UNPUBLISHED STATISTICS
More detailed small business statistics from the survey are available on request from the ABS. For example, many of the statistics presented here may be available by different cross classifications from the data presented in the publication.
COMMENTS ON THIS PUBLICATION
The ABS welcomes comments and suggestions from users on for future surveys. These should be addressed to the Director, Business Demographics and Frames Section, Australian Bureau of Statistics, Locked Bag 10, Belconnen ACT 2616
ROUNDING
Where figures have been rounded discrepancies may occur between the sum of component items and the total.
INQUIRIES
For further information about these and related statistics, contact the National Information and Referral Service on 1300 135 070 or Helen Harkin on Canberra (02) 6252 6531.
CHARACTERISTICS OF SMALL BUSINESS OPERATORS
This chapter presents information on the characteristics of Australian small business operators, including their sex, age, location, hours worked and place of birth.
NUMBER OF OPERATORS
In June 2004 there were 1,660,000 operators of the 1,269,000 non-agricultural small businesses in Australia.
At June 2004:
- small businesses with only one operator accounted for 72.6% of all small businesses up from 68.5% in 2003
- the proportion of small businesses with two operators was 25.1%, down from 29.0% at June 2003.
NUMBER OF BUSINESSES OPERATED
At June 2004, the majority of small business operators were involved in one business only (92.5%), a proportion which remained relatively unchanged from the June 2003 estimate.
By sex
The majority of both male and female small business operators ran a single business at June 2004. Incidence of operation of multiple businesses by males and females was 7.8% and 6.9% respectively.
By state and territory
The proportions of operators involved in only one business were similar across all states and territories (between 91.6% and 94.0%).
SEX OF OPERATORS
Males comprised 1,131,000 (68.1%) of all non-agricultural small business operators. There were 529,000 (31.9%) female small business operators. These proportions have remained relatively unchanged since 1995.
LOCATION OF OPERATORS
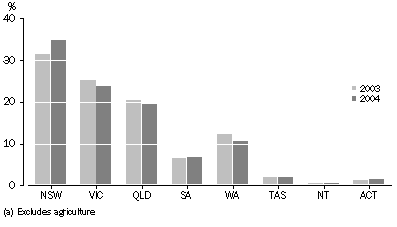
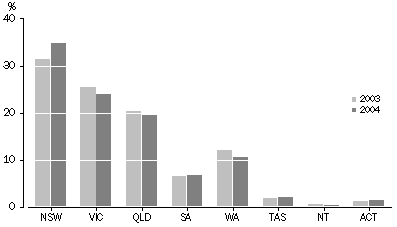
The graph below illustrates the distribution of small business operators across states and territories. This distribution generally reflected the population distribution.
Proportion of Small Business Operators (a), by State: June 2003 - June 2004
AGE OF OPERATORS
Table 1.1 shows that the majority of small business operators (59.4%) were aged between 30 and 50 years at June 2004, an increase of 1.8 percentage points. The proportion of operators aged greater than 50 years fell by 2.0 percentage points. Since 1995 there has been an increase in the proportion of operators aged greater than 50 years (7.0 percentage points) and a decrease in operators aged 30 to 50 years (-5.3 percentage points).
By sex
The distribution of small business operators at June 2004 by sex across age categories is shown in the following graph. Male operators made up the largest proportion in all age categories.
PROPORTION OF SMALL BUSINESS OPERATORS, by age and by sex - June 2004
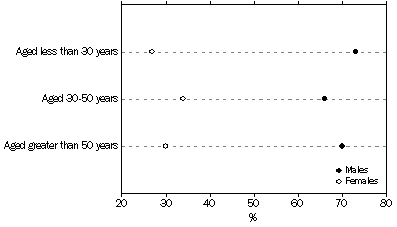
The most significant change in the overall distributions was in the group of small business operators aged less than 30 years, where the proportion of male operators rose from 65.2% at June 2003 to 72.6% at June 2004, resulting in a commensurate drop in the proportion of female operators.
For male small business operators, the proportions of those aged less than 30 years and 30 to 50 years increased by 1.0 and 1.3 percentage points respectively.
For female small business operators, the proportion of those aged 30 to 50 years increased (2.9 percentage points), whilst those aged less than 30 years recorded the largest decrease (-1.7 percentage points).
By state and territory
In all states and territories the majority of small business operators were in the 30 to 50 year age category. This proportion ranged from 50.6% in Northern Territory to 61.2% in Western Australia. Business operators aged less than 30 years comprised the smallest proportion of operators in all states and territories (ranging from 6.8% to 12.9%).
New South Wales and Western Australia both recorded significant increases in the proportion of operators aged 30 to 50 years, 3.1 and 7.0 percentage points respectively. They also both recorded corresponding decreases in the proportion of operators aged greater than 50 years, -3.6 percentage points in New South Wales and -4.2 percentage points in Western Australia.
USUAL HOURS WORKED BY OPERATORS
Full-time operators
The 1,660,000 non-agricultural small business operators in Australia at June 2004 included 1,114,000 (67.1%) full-time operators.
The 1.1 million full-time small business operators comprised:
- 65.1% who usually worked between 35 and 50 hours each week
- 30.2% who usually worked between 51 and 75 hours each week
- 4.7% who usually worked more than 75 hours each week.
This reflected a rise of 3.3 percentage points in full-time operators working between 35 and 50 hours each week and decreases in the other categories. The proportion of full-time operators working between 35 and 50 hours each week has gradually increased since 1995, rising from 59.9% to 65.1% in 2004.
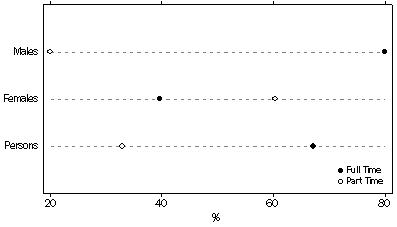
By Sex
An estimated 80.0% of male small business operators worked full-time. Of these, 36.6% worked more than 50 hours a week. These proportions remained relatively unchanged from June 2003.
However, only 39.6% of female operators worked full-time. Of these, 27.5% worked more than 50 hours a week.
The proportions of both male and female full-time small business operators working between 51 and 75 hours a week decreased by 2.4 and 4.1 percentage points respectively.
Proportion of business operators, by employment status and sex - June 2004
By State and Territory
Across the states, the proportions of operators working full-time in their business remained largely unchanged between June 2003 and June 2004. The exceptions were Western Australia which increased 3.4 percentage points to 65.0%, and South Australia which decreased by 3.4 percentage points to 61.2%, the lowest proportion of any state. The highest proportion (86.2%) of full time operators was in the Northern Territory which recorded an increase of 10.0 percentage points.
Part-time operators
In June 2004, part-time operators constituted 32.9% (546,000) of the 1,660,000 small business operators in Australia.
Female operators comprised the majority of all operators working part-time (58.6%), down from 61.6% at June 2003, and 66.6% in 1995.
The proportion of female small business operators working part-time fell by 2.0 percentage points to June 2004 whilst the proportion of male operators rose slightly (0.7 percentage points).
OPERATORS BORN IN AUSTRALIA OR BORN OVERSEAS
In June 2004, 30.2% (500,900) of all small business operators were born overseas, a rise of 0.8 percentage points from June 2003.
By sex
Proportions of overseas born male (31.1%) and female (28.2%) operators both increased in the twelve months to June 2004 by 0.5 and 1.2 percentage points respectively.
By state and territory
The states and territories with the highest proportions of small business operators who were born overseas were Western Australia (38.7%), Northern Territory (34.5%) and New South Wales (31.0%). Tasmania continued to record the lowest proportion of overseas born small business operators (22.2%).
CHARACTERISTICS OF SMALL BUSINESSES
This chapter presents selected characteristics of small businesses including details of the ownership structure, length of operation, the use of computers and Internet access. Data are classified by state and territory and business size, and by sex of operators.
Estimates of businesses from the June 2003 and June 2004 surveys are presented in the tables, together with estimates of the annual change in percentage points to assist analysis.
NUMBER OF BUSINESSES
There were an estimated 1,269,000 small businesses operating in Australia in June 2004.
At June 2004:
- 56.3% (715,000) were non-employing businesses, down from 56.5 in June 2003
- 32.8% (416,000) employed 1-4 people, a slight drop from 33.0% in June 2003
- 10.9% (139,000) employed 5-19 people, up from 10.5% in June 2003.
EMPLOYER SIZE GROUP
There was little change in the relative proportions of small businesses classified by employer size over the last 12 months. The majority of small businesses (56.3%) were non-employing businesses. The proportions of businesses with 1-4 employees (32.8%) and 5-19 employees (10.9%) remained stable.
The proportion of non-employing businesses (58.3%) has increased since February 1995 (48.3%). Consequently, the proportion of businesses with 5-19 employees decreased from 17.8% in 1995 to 10.9% in 2004.
LOCATION OF OPERATION
The distribution of small businesses across states and territories at June 2004 reflected the general population distribution within Australia at that time.
Proportion of Total Small Businesses, by State: June 2003 - June 2004
By employer size group
Non-employing businesses comprised the majority of small businesses in all states. However, there were considerable differences in the proportions; the Australian Capital Territory recorded the largest proportion of non-employing businesses (65.8%) followed by South Australia (63.1%). In Victoria (50.5%) and New South Wales (54.2%) non-employing businesses comprised a smaller proportion of all small businesses.
Proportion of Small businesses, by State and by business employer size group - June 2004

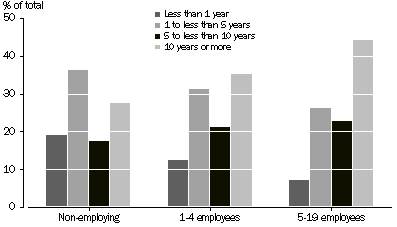
LENGTH OF OPERATION
At June 2004 the majority of small businesses had been in operation from one to less than five years (33.5%), a proportion largely unchanged from 2003.
The largest proportional change at June 2004 was for businesses aged less than one year which increased by 2.6 percentage points to 15.5%.
By size of business
The majority of non-employing businesses, 36.2%, had been in operation from one to less than five years. For businesses employing 1-4 people, the majority had been in operation for ten years or more (35.2%). The majority of businesses (44.1%) in the 5-19 employee size category had also been in operation for ten years or more.
proportion of businesses, by employment size group and by length of operation - June 2004
OPERATORS PER BUSINESS
At June 2004, 72.6% (921,000) of all small businesses were operated by a single operator, an increase of 4.1 percentage points. The percentage of businesses with two operators decreased to 25.1%, a drop of 3.9 percentage points.
By size of business
On average the number of operators per small business increased commensurately with the business employer size.
PREDOMINANT SEX OF OPERATORS
There were 1,269,000 small businesses in Australia in June 2004, of which (62.0%) were operated by an individual male or predominantly by males, a significant increase from June 2003 (55.1%).
There were 21.5% (273,000) of businesses operated by equal numbers of males and females. The proportion of businesses in this category declined by 3.9 percentage points. There were 16.5% of businesses operated predominantly by females, a drop of 3.0 percentage points on the June 2003 estimate.
proportion of small businesses, by predominant sex of operator(s): June 2003 - June 2004

By size of business
The non-employing business category was the most common business size group for both predominantly male operated businesses (57.7%) and for predominantly female operated businesses (83.2%). However, businesses operated by equal numbers of males and females recorded a significantly smaller proportion of non-employing businesses (31.7%).
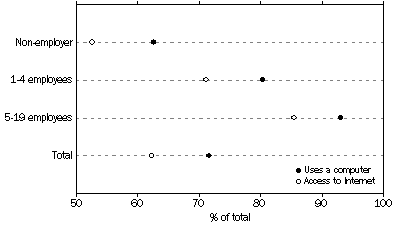
USE OF COMPUTERS AND THE INTERNET
When comparing these results to those of other ABS series, it should be noted that some series only measure the use of computers and the Internet by employing businesses.
In June 2004, 71.7% of small businesses reported that they were using computers in their business operations, a similar proportion to that recorded in June 2003. The proportion of businesses with access to the Internet (62.3%) also remained relatively unchanged from that recorded in June 2003. There was no significant change in the proportions of small businesses using computers in the twelve months to June 2004 for any of the employer size categories.
As the size of the business increased so too did the likelihood that the business used a computer, with 93.0% of businesses which employed 5-19 people, using a computer, compared to only 62.6% of non-employing businesses. Access to the Internet was more common in larger businesses.
proportion of small businesses, by employer size group which use computers and access the Internet - June 2004
For businesses which access the Internet, the most common usage was for email (86.9%), research (82.6%), and 'other' (89.1%).
The Internet was used by 34.4% of all small businesses for 'making or receiving payments', an increase of 5.1 percentage points from June 2003.
It should be noted that 'making or receiving payments', is not a measure of E-commerce or I-commerce, as these are defined as ordering goods and services electronically or via the Internet, not on the method of making/receiving payments.
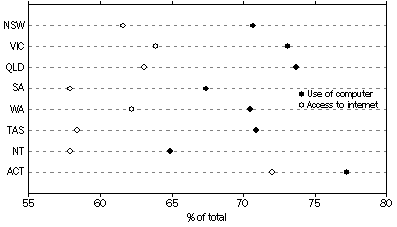
By state and territory
The proportion of small businesses across states and territories using computers in their business operations ranged from 64.9% to 77.2%, the national average being 71.7%. The Australian Capital Territory recorded the highest proportion of businesses with computers for all business size ranges.
Access to the Internet across states and territories followed a similar pattern to that of computer usage, with levels highest in the Australian Capital Territory (72.0%) and lowest in the Northern Territory (57.9%).
Proportion of small businesses, by State, which use computers and access the Internet - June 2004
HOME BASED SMALL BUSINESS
Home based businesses have been identified based on two definitions:
- where most of the work of the business was carried out at the home(s) of the operator(s) - these businesses are referred to as 'Businesses operated at home'
- where the business has no other premises owned or rented other than the home(s) of the operator(s) - these businesses are referred to as 'Businesses operated from home'.
When combining figures for the two groups it should be noted that some overlap does occur.
In the first edition of this publication (1995), businesses were considered home based if 'one or more of the operators of the business worked more hours at home than away from home'. This definition is similar to the category 'Businesses operated at home' (as defined above), but is not strictly comparable.
NUMBER OF HOME BASED BUSINESSES
Home based businesses make up a very large proportion of the total small business population in Australia. At June 2004, it was estimated that 67.5% of all small businesses were home based, compared to 58.3% in February 1997. These businesses were operated by 1,040,000 people, representing 62.6% of all small business operators. This reflected annual increases in the proportions of home based businesses and operators, 1.0 and 0.5 percentage points respectively.
At June 2004, 95.8% of all home based small businesses were operated from home, a proportion similar to that recorded for June 2003 and February 1997. There were 31.3% (268,000) of all home based small businesses which were operated at home. This was a decrease of 4.4 percentage points from June 2003. As noted above, overlap can occur between the 'operated at home' and 'operated from home' categories as businesses can operate without premises and also have most of the work carried out at the home of the operator(s), therefore satisfying both definitions. In June 2004, 27.0% (231,000) of all home based businesses were such businesses, involving 27.7% of all home based business operators.
Home Based Small Businesses, June 2004 |
|  |
| Number of businesses | Number of operators | |
| '000 | '000 | |
| |
| Operated from home | 820 | 991 | |
| Operated at home | 268 | 337 | |
| Operated both from home and at home | 231 | 288 | |
| Total home based, operating either from home or at home | 856 | 1,040 | |
| |
By Size
There were 856,000 home based small businesses operating at June 2004, of which the majority (68.8%) were non-employing businesses. Of the remainder, 240,000 (28.1%) businesses employed 1-4 people and 26,000 (3.1%) employed 5-19 people.
By Length of Operation
In terms of length of business operation, home based businesses followed a similar distribution pattern to that of total small business with:
- 16.9% in operation for less than one year old
- 36.2% in operation for one year to less than five years
- 17.6% in operation for five years to less than ten years
- 29.3% in operation for ten years or more
The most significant annual increase occurred in the proportion of home-based businesses in operation for less than one year which rose by 2.1 percentage points to 16.9%.
Operators per Business
The majority (79.8%) of home based small businesses were single operator businesses. This proportion was higher than that recorded for small businesses overall, where 72.6% were single operator businesses.
Predominant Gender of Operators
Most home based small businesses (65.5%) were operated predominantly by males, a significant increase from the proportion recorded at June 2003 (58.2%). Consequently, the proportion of home based businesses operated predominantly by females decreased from 21.0% in June 2003 to 17.3% in June 2004. The proportion of businesses operated by equal numbers of males and females dropped by 3.6 percentage points to 17.2%.
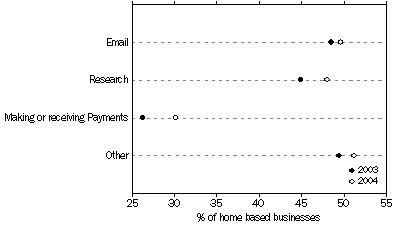
Use of Computers and the Internet
At June 2004, 68.2% of Australia's home based businesses were using computers in their business operations, compared to 71.7% for all small businesses. The majority of these home based businesses (86.2%), had access to the Internet. The most common use of the Internet by home based businesses was for email and 'other' purposes. Use of the Internet for all purposes increased, but particularly for 'making or receiving payments'.
Proportions of home based businesses, by Internet usage: June 2003 - June 2004
OPERATORS OF HOME BASED BUSINESSES
By sex
At June 2004, 70.7% (736,000) of all home based business operators were male, this represented a proportional increase of 2.9 percentage points. The proportion of female operators fell to 29.3% (304,000 operators).
By age
The age distribution of home based small business operators was similar to the overall distribution for all small businesses, with 10.9% aged less than 30 years, 58.4% aged between 30 and 50 years, and 30.7% aged more than 50 years. These proportions remained relatively unchanged since June 2003.
By hours worked
At June 2004, home based operators were more likely to be working part time than all small business operators, with 39.6% usually working less than 35 hours a week. This compares with 32.9% for all small business operators.
Born in Australia or born overseas
The proportion of home based small business operators who were born overseas (29.8%) was relatively consistent with the proportion for all small business operators.
Number of businesses operated
At June 2004, 93.9% of home based small business operators were involved in one business only. This compared with 92.5% for all small businesses.
By state and territory
Home based small business operators were distributed across states and territories in a proportion similar to small business operators overall. Both proportions generally reflected the general population distribution within Australia.
 Print Page
 Print All