YEAR 12 ATTAINMENT
This article is also available as a PDF - Download the PDF here
Have your say below
INTRODUCTION
Within Australia, Year 12 attainment is regarded as a key factor in the formal development of an individual's skills and knowledge. Those with Year 12 have a greater likelihood of continuing with further study, particularly in higher education, as well as entering into the workforce. Year 12 attainment contributes to the development of a skilled workforce, and in turn, to ongoing economic development and improved living conditions. The Council of Australian Governments' National Education Agreement (2009) aims to lift the Year 12 or equivalent attainment rate for 20-24 year olds to 90% by 2015. (Endnote 1)
The first half of this article looks at recent trends in Year 12 attainment for young adults (aged 20-24 years), while the second half examines the influence of Year 12 on further education, income and employment outcomes across the life course.
DATA SOURCE AND DEFINITIONS
Data in this article come mainly from the ABS Surveys of Education and Work, the ABS 2009 Survey of Education and Training, and the ABS National Aboriginal and Torres Strait Islander Social Survey.
Year 12 marks the completion of the Senior Secondary Certificate of Education. Entry to this level is usually the completion of Year 11 or equivalent and the duration is usually one year of full-time study.
Non-school qualifications refer to qualifications at the Postgraduate degree level, Master degree level, Graduate diploma and Graduate certificate level, Bachelor degree level, Advanced diploma and Diploma level and Certificates I, II, III, IV level and certificate not further defined. |
| WHO ATTAINS YEAR 12?
In 2010, around 1.2 million young adults (aged 20-24 years) had attained Year 12. Over the past decade the proportion of 20-24 year olds with Year 12 has gradually increased, rising from 71% in 2001 to 78% in 2010.
Sex
Over the past decade young women (aged 20-24 years) have been consistently more likely than young men to have attained Year 12, although both have experienced increases at much the same rate. In 2001, around two-thirds of young men (67%) and three-quarters of young women (74%) had attained Year 12. By 2010, this had increased to 73% of young men and 83% of young women. The difference between the rates for young men and women may reflect the better opportunities that exist for young men to access full-time work. (Endnote 2)
PROPORTION OF 20-24 YEAR OLDS WITH YEAR 12 - 2001-2010
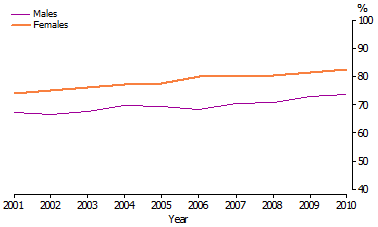 Source: ABS 2001 Transition from Education to Work Survey; 2002-2010 Surveys of Education and Work
Where people live
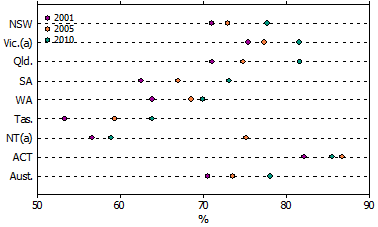
In 2010, young adults (20-24 years) were more likely to have attained Year 12 if they lived in Major Cities (81%) compared with Inner or Outer Regional Areas (67%) and Remote or Very Remote Areas (64%).
Between 2001 and 2010, the proportion of 20-24 year olds with Year 12 increased in most states and territories. Queensland, South Australia and Tasmania had the largest increases (between 10 to 11 percentage points).
Over this period, there was also considerable variation between the proportions of 20-24 year olds with Year 12 across the states and territories. For example, in 2010 the proportion of people (20-24 years) with Year 12 ranged from 59% in the Northern Territory to 86% in the Australian Capital Territory.
However, state and regional differences are related to a number of factors. In particular, once young adults (20-24 years) have attained Year 12 they may move interstate or across urban, regional and remote areas to pursue employment opportunities or post school education.
PROPORTION OF 20-24 YEAR OLDS WITH YEAR 12 BY STATES AND TERRITORIES - 2001, 2005 AND 2010
 (a) Difference between 2001 and 2010 is not statistically significant.
Source: ABS 2001 Transition from Education to Work Survey; 2005 and 2010 Surveys of Education and Work
(a) Difference between 2001 and 2010 is not statistically significant.
Source: ABS 2001 Transition from Education to Work Survey; 2005 and 2010 Surveys of Education and Work
INDIGENOUS AUSTRALIANS
Aboriginal and Torres Strait Islander Australians have far lower rates of Year 12 attainment than non-Indigenous Australians. COAG's National Indigenous Reform Agreement aims to halve the gap for Indigenous students in Year 12 and equivalent attainment by 2020.
In 2008, around one-third (31%) of young Indigenous people (20-24 years) had attained Year 12 compared with over three-quarters of
non-Indigenous 20-24 year olds (76%). Between 2002 and 2008, there was a small, but not statistically significant, increase in the proportions of Indigenous people aged 20-24 years with Year 12 (from 28% to 31%). (Endnote 3)
For more information on Indigenous people and education, see 'Education and Indigenous Wellbeing' in Australian Social Trends March 2011 (cat. no. 4102.0) and ABS National Aboriginal and Torres Strait Islander Social Survey, 2008 (cat. no. 4714.0). |
Parental characteristics
Parental characteristics can be influential on the educational outcomes of their children. In 2009, data from the Survey of Education and Training showed that people aged 20-24 years (who knew what year of secondary school their mother and father had completed), were more likely to have attained Year 12 if both their parents/guardians had attained Year 12 (90%), compared with one or neither parent/guardian having attained Year 12 (78% and 68% respectively).
PROPORTION OF 20-24 YEAR OLDS WITH YEAR 12 BY WHETHER PARENT(a) HAD YEAR 12 - 2009
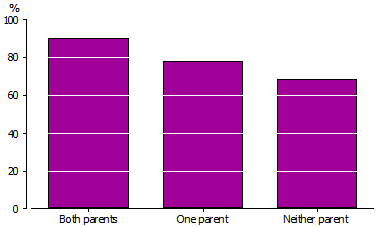
(a) Parent also includes guardian.
Source: ABS 2009 Survey of Education and Training
APPARENT RETENTION RATE
The apparent retention rate is an alternative way to measure the proportion of Australian students continuing their secondary school education. It is calculated by dividing the number of full-time students in Year 12 by the number of full-time students in the base year and converting the figure into a percentage. The base year is Year 7 in New South Wales, Victoria, Tasmania and the Australian Capital Territory and Year 8 in Queensland, South Australia, Western Australia and the Northern Territory.
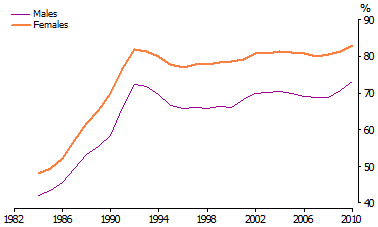
Between 1984 and 1992, the proportion of students continuing through to Year 12 markedly increased (rising from 45% to a peak of 77%). This reflects the growing importance of educational qualifications for employment outcomes over this time. Since decreasing slightly in the early nineties, the apparent retention rate remained relatively stable (at around 75%) from 2002 to 2008, before rising to 78% in 2010.
Since 1984, female students have been more likely to continue through to Year 12 than male students. In 2010, the Year 12 apparent retention rate for female students was 83% compared with 73% for male students.
YEAR 7/8 TO YEAR 12 APPARENT RETENTION RATE(a) - 1984-2010
 (a) Refers to full-time students only.
Source: ABS Schools, Australia, 1984-2010 (cat. no. 4221.0) |
Disability
Health conditions and disability may impact on schooling and the attainment of Year 12. In 2009, around one-fifth (22%) of all 20-24 year olds had a disability or were restricted by a long term health condition (for example, asthma or a mental health condition). Of these, around three-fifths (62%) had attained Year 12 compared with almost four-fifths (78%) of those who did not have a disability or a restrictive long term health condition. Those who had a profound or severe disability were far less likely to have attained Year 12 (46%) than those who had a moderate or mild disability (73%).
Of the 305,900 young adults (20-24 years) who had a disability or a restrictive long term health condition, almost one-quarter (76,200 people) were categorised as having an education restriction (for example, needing time off from regular classes or requiring special tuition). Of this group only around a half (53%) had attained Year 12.
Health
Self-assessed health is a good indicator of the overall health of a population, providing some insight into how a person perceives their own health at a given point in time. Those with poor self-assessed health were less likely to have attained Year 12 than those with better self-assessed health.
In 2009, the proportion of 20-24 year olds with Year 12 increased as the level of self-assessed health improved. For example, only one-half (50%) of those who rated their health as poor or fair had attained Year 12, compared with almost four-fifths (79%) who rated their health as very good or excellent.
LEVEL OF SELF-ASSESSED HEALTH STATUS BY YEAR 12 ATTAINMENT FOR 20-24 YEAR OLDS - 2009
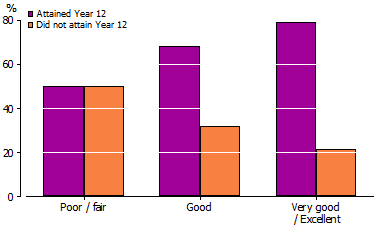
Source: ABS 2009 Survey of Education and Training
PATHWAYS AFTER YEAR 12
Year 12 attainment is recognised as providing pathways into further education and into the workforce. The following analysis examines the influence of Year 12 on the enrolment in further study by young people, as well as outcomes in education, employment and income through the life course.
Non-school qualifications |
In 2010, young adults who had attained Year 12 were both more likely to be studying for, and to have attained, a non-school qualification than those who had not.
Almost one-half (46%) of young adults (20-24 years) with Year 12 were enrolled in study for a non-school qualification at the time of the survey. This was over two and a half times the rate for those without Year 12 (17%).
Across selected age groups between 20–64 years, people with Year 12 were more likely to have completed a non-school qualification than those without Year 12. The gap was narrowest for 20-24 year olds (46% compared with 38%) and greatest for 55-64 year olds (73% compared with 38%).
For all 20-64 year olds with a non-school qualification, the level of attainment was likely to be higher if they had completed Year 12 than if they had not. Of the 5.5 million 20-64 year olds with Year 12 and a non-school qualification, most (59%) had attained a Bachelor degree or above, followed by a Certificate I, II, III or IV (23%) and an Advanced diploma or diploma (18%). For those who had not attained Year 12 and had attained a non-school qualification, over three-quarters (75%) had attained a Certificate I, II, III or IV.
PROPORTION OF PEOPLE IN SELECTED AGE GROUPS WITH A NON-SCHOOL QUALIFICATION BY YEAR 12 ATTAINMENT - 2010
Source: ABS 2010 Survey of Education and Work
20-64 YEAR OLDS WITH A NON-SCHOOL QUALIFICATION: LEVEL OF HIGHEST NON-SCHOOL QUALIFICATION BY YEAR 12 ATTAINMENT - 2010
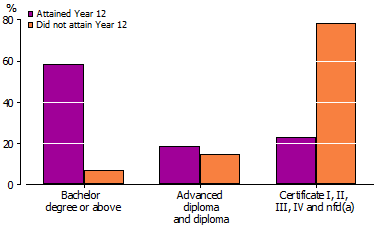
(a) Certificate not further defined.
Source: ABS 2010 Survey of Education and Work
COUNCIL OF AUSTRALIAN GOVERNMENTS (COAG)
COAG's National Education Agreement (2009) places considerable importance on Year 12 education and aims to lift the proportion of 20-24 year olds with Year 12 or a Certificate II to 90% by 2015. The COAG attainment target for 2020 has since been amended to measure those with Year 12 or a Certificate III. Certificate III is recognised as the international standard of equivalence of upper secondary education. (Endnote 4)
Between 2001 and 2010, the proportion of 20-24 year olds who had attained Year 12 or a Certificate II increased from 79% to 86%. Similarly, the proportion of 20-24 year olds who had attained Year 12 or a Certificate III increased from 77% to 85%.
PROPORTION OF 20-24 YEAR OLDS WHO HAD ATTAINED YEAR 12 AND/OR CERTIFICATE II OR CERTIFICATE III(a) - 2001-2010
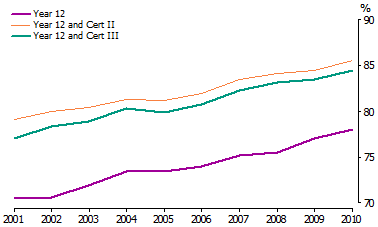
(a) And/or above.
Source: ABS 2001 Transition from Education to Work Survey; 2002-2010 Surveys of Education and Work; ABS Education and Work, Australia, May 2010 (cat. no. 6227.0) |
Apprenticeships
In 2010, there were around 72,000 employed 20-24 year olds who were trainees or apprentices, with males comprising the majority of this group (88%). Two-thirds (66%) of these trainees or apprentices had attained Year 12.
Traditionally, apprenticeships and traineeships have offered alternative training-employment pathways for students who have not attained Year 12, particularly for young men. However, most recently the majority of young people employed as apprentices have attained Year 12.
Employment
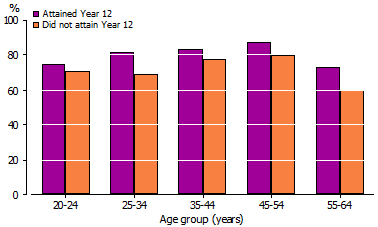
In 2010, people aged 20-64 years were more likely to be employed if they had attained Year 12 than those who had not (81% compared with 72%). The greater likelihood of those with Year 12 being employed was maintained throughout most of the life course. In particular, the gap widened for those aged 25-34 years (82% compared with 69%) and for those aged 55-64 years (73% compared with 60%).
For more information on young people's engagement in education and work see 'Are young people learning or earning?' in Australian Social Trends March 2010 (cat. no. 4102.0).
PROPORTION OF PEOPLE WHO WERE EMPLOYED BY YEAR 12 ATTAINMENT AND AGE - 2010
Source: ABS 2010 Survey of Education and Work
Occupation
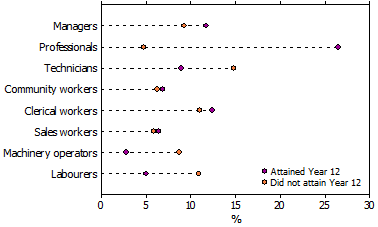
People who had attained Year 12 were more likely to be working in traditional 'white collar' jobs than those who had not.
In 2010, the most common occupations amongst 20-64 year olds who were employed and had attained Year 12 were Professionals (33%), Clerical and administrative workers, and Managers (both 15%). In comparison, the most common occupations for those who were employed and had not attained Year 12 were Technicians and trades workers (21%), Labourers, and Clerical and administrative workers (both 15%), while just 7% were Professionals.
YEAR 12 ATTAINMENT BY OCCUPATION, EMPLOYED 20-64 YEAR OLDS - 2010
Source: ABS 2010 Survey of Education and Work
Income
This analysis examines the distribution of personal gross weekly income (from all sources) between those with and without Year 12 across income quintiles and is restricted to those in the labour force. A quintile is derived by ranking all the population from lowest to highest income and then dividing that population into five equal groups. The lowest quintile is made up of the 20% of the population with the lowest income.
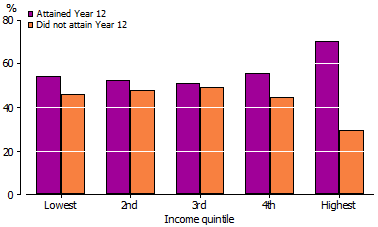
In 2009, people aged 20-64 years who had personal gross weekly income in the highest quintile were far more likely to have attained Year 12 (70%) than those who had not (30%). However, while people were still more likely to have Year 12 across the other four quintiles of the income distribution, the differences were far less pronounced.
PERSONAL GROSS WEEKLY INCOME FROM ALL SOURCE FOR 20-64 YEAR OLDS BY YEAR 12 ATTAINMENT(a)(b) - 2009
(a) Restricted to 20-64 year olds who are in the labour force.
(b) Due to a number of reasons (including the possession of assets or underreporting) people in the lowest income decile may not necessarily be experiencing economic hardship. Please see the Explanatory Notes in Household Income and Income Distribution (cat. no. 6523.0) for further information.
Source: ABS 2009 Survey of Education and Training
INTERNATIONAL COMPARISONS
The world's education systems vary widely in terms of structure and curricular content. In this section, the analysis focuses on those with at least upper secondary education (International Standard Classification of Education level 3), which corresponds to the final stage of secondary education in most OECD countries. (Endnote 5) In Australia, this equates to those with at least Year 12 and/or a Certificate III.
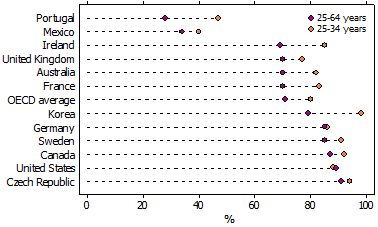
In 2008, the proportion of 25-64 year olds with at least upper secondary education varied greatly across OECD countries. The proportion ranged from under three-tenths (28%) in Portugal to over nine-tenths (91%) in the Czech Republic. In Australia, 70% of 25-64 year olds had at least upper secondary education, similar to the OECD average (71%), France (70%), the United Kingdom (70%) and New Zealand (72%).
Most countries had a larger proportion of 25-34 year olds with at least upper secondary education compared with older age groups. For example, in 2008 the OECD average of people aged 25-34 years with at least upper secondary education was 80% compared with 58% of 55-64 year olds. In Australia, over four-fifths (82%) of 25-34 year olds had at least upper secondary education compared with 55% of 55-64 year olds. This may reflect an internationally growing priority being given to educational attainment for improved employment outcomes and further education opportunities, as well as people’s growing aspirations for higher education for their children.
PROPORTION OF PEOPLE WITH AT LEAST UPPER SECONDARY EDUCATION(a) BY COUNTRY AND AGE - 2008
(a) Upper secondary education refers to ISCED3 and corresponds to the final stage of secondary education in most OECD countries.
Source: OECD September 2010, Education at a Glance 2010, OECD Indicators, <www.oecd.com>
ENDNOTES
1. Under the original COAG agreement, the target was to be reached by 2020, this was later amended to 2015 in the Compact with Young Australians. Australian Government, 30 April 2009, Compact with Young Australians: Increasing educational attainment of young people aged 15-24, Commonwealth of Australia, Canberra, <www.coag.gov.au>.
2.
Foundation for Young Australians, 2009,
How Young People are Faring 2009, Foundation of Young Australians, Melbourne, p. 5, <
www.fya.org.au>.
3.
Data in this section is derived from the ABS 2008 National Aboriginal and Torres Strait Islander Social Survey for the Indigenous population and the ABS 2008 Survey of Education and Work for non-Indigenous people.
4.
COAG Reform Council, 2009,
National Education Agreement: Performance report for 2009, Chapter 8: COAG Targets, p.99-100, Commonwealth of Australia, <
www.coag.gov.au>.
5.
Organisation for Economic Development and Cooperation (OECD), 2010,
Education at a Glance 2010: OECD Indicators, Glossary, OECD, France, <
www.oecd.org>.
 HAVE YOUR SAY HAVE YOUR SAY
Please direct all statistical enquiries to the National Information and Referral Services (NIRS) by emailing client.services@abs.gov.au
Articles in Australian Social Trends are designed to provide an overview of a current social issue. We aim to present an interesting and easy-to-read story, balanced with appropriate statistics. The articles are written as a starting point or summary of the issues, for a wide audience including policy makers, researchers, journalists and people who just want to have a better understanding of a topic. For people who need further information, we provide references to other useful and more detailed sources. Tell us if we are achieving this aim by emailing social.reporting@abs.gov.au |
 Print Page
 Print All