FEATURE ARTICLE 1: REGIONAL HOUSING IN WESTERN AUSTRALIA
INTRODUCTION
Since the turn of the new millennium Western Australia has undergone a period of significant economic and population growth, spurred by major resource investment in the state. This has seen pressure placed on the Western Australian housing market, both in Perth and in a number of regional areas. This pressure has been manifested through substantial rises in both the costs of established and new homes and a blow out in construction times due to capacity constraints in the building industry. While much attention has been focussed on the Perth housing market, this article will concentrate on regional Western Australia and examine the changes that have occurred over the period covered by the 1996, 2001 and 2006 Censuses of Population and Housing. Selected regional areas have been chosen to illustrate these changes, highlighting both growth and decline. Note that due to differences in geographic classifications (i.e. local government area; urban centre) and counting methods (i.e. estimated resident population; place of enumeration count) there may be some differences in totals shown.
THE ECONOMY
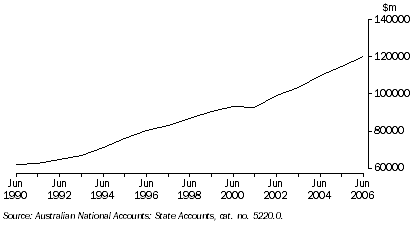
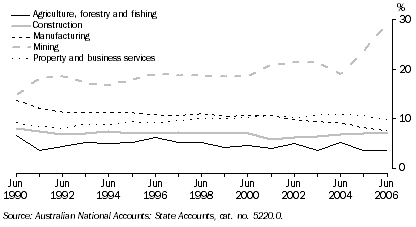
The Western Australian economy has doubled in size over the past 16 years, with Gross State Product (GSP) in chain volume terms rising 107% between 1990-2006. It has traditionally had a strong and growing minerals sector, solid property and business services, construction and manufacturing sectors, and an ongoing dependence on agricultural production. While the agriculture, forestry and fishing and manufacturing sectors have grown in absolute terms, they have declined in relative terms compared to the mining sector. The contribution to GSP of agriculture, forestry and fishing has declined from 7% to 2% and the contribution of manufacturing has declined from 14% to 8% in the past 16 years. The contribution of mining to GSP has doubled (15% to 30%), while the sectors of property and business services (9% to 11%) and construction (8%) have remained fairly steady contributors. Since the 1970's mining has consolidated its position as the major generator of export income for Western Australia, currently comprising some 70% of total exports revenue.
GROSS STATE PRODUCT, Chain volume measures
- Western Australia
 INDUSTRY CONTRIBUTION TO GSP,
 Western Australia
EMPLOYMENT
Coinciding with the current resources boom has been a sustained increase in the number of employed persons in Western Australia and a consequent decline in unemployment. In November 2004 the number of employed persons (trend) in Western Australia surpassed the one million mark. At the time of the 1996 Census the unemployment rate (trend) in Western Australia was 7.5%. By the 2001 Census this rate had declined to 7.1%, and by August 2006 it had more than halved to 3.4%. Between August 1996-2006, 27% (227,100 persons) more people were employed in Western Australia and the number of unemployed persons had almost halved to 30,100.
UNEMPLOYMENT RATE, Trend
- Western Australia

Many of the new jobs created by the resources boom are full-time, male positions, in regional mining areas and Perth. This has created extreme pressure on housing stocks in those areas. While the mining industry has been at the forefront of the resources boom and has seen job creation soar, most of the new positions created have been Perth based as administrative and fly-in fly-out positions have increased. Over the decade 1996-2006 direct employment in the mining industry grew 105% in Perth, but only 29% in regional Western Australia - although regional areas benefited through higher employment in associated industries such as construction, manufacturing, transport and service industries.
The Department of Workplace Relations' Small Area Labour Markets series for June 2006 reported the Perth metropolitan area as having an unemployment rate of 4.1%, with regional Western Australia slightly lower at 3.9%. Rates varied widely in the regions, from 0.4% in the Shire of Lake Grace to 16% in the Shire of Halls Creek.
DEMOGRAPHIC CHANGES
The estimated resident population of Western Australia in June 1996 was 1.8 million. By June 2006 it had increased 17% to just over 2 million persons. Population growth in Perth and regional Western Australia was similar, although growth in the regions was less consistent. The South-West and Pilbara regions recorded the largest increases in population in regional Western Australia. The expansion of the urban conglomeration of Bunbury was evident with the adjoining Shire of Capel (up 8.4%) being the fastest growing regional Local Government Area (LGA) between 2001-2006 and the adjoining Shire of Dardanup being the fifth fastest (up 3.8%). Both of these LGAs contain a part of the urban expansion of Bunbury. From a relatively low base Ravensthorpe was the second fastest growing regional LGA (up 6.2%). The Shire of East Pilbara, which declined in population between 1996-2001, rebounded strongly to record the third highest average annual growth over the 2001-2006 inter-censal period.
POPULATION GROWTH(a), By LGA - Western Australia |
|  |
| 1996 | 2001 | 2006 | 2001-2006 average annual growth | |
| no. | no. | no. | % | |
| |
| Capel (S) | 5 989 | 7 107 | 10 630 | 8.4 | |
| Ravensthorpe (S) | 1 433 | 1 504 | 2 029 | 6.2 | |
| East Pilbara (S) | 6 755 | 5 628 | 7 160 | 4.9 | |
| Chittering (S) | 2 409 | 2 936 | 3 683 | 4.6 | |
| Dardanup (S) | 6 658 | 8 955 | 10 777 | 3.8 | |
| Mandurah (S) | 40 460 | 48 877 | 58 457 | 3.6 | |
| Roebourne (S) | 13 829 | 15 058 | 17 671 | 3.3 | |
| Greenough (S) | 10 701 | 12 634 | 14 789 | 3.2 | |
| Busselton (S) | 18 158 | 23 099 | 26 638 | 2.9 | |
| Murray (S) | 9 510 | 10 875 | 12 554 | 2.9 | |
| |
| (a) Estimated resident population as at 30 June. |
| Regional Population Growth, Australia, cat. no. 3218.0. |
Western Australia’s population growth between 1996-2006 was due to a combination of natural increase and overseas migration. Over the ten years to 2006, Western Australia grew by an annual average of over 30,000 persons. Natural increase (births minus deaths) accounted for just under 14,000 persons per year and overseas migration for more than 15,000 persons per year. Interstate migration contributed only 513 persons per year on average between 1996-2006 and was negative in four and positive in six of those years. The average was boosted by a high rate of interstate migration between 2005-2006 of 3,549 persons per year. In Queensland a large influx of residents from other states kept that state’s population growth the highest in the nation, but Western Australia, which had the second strongest growth of the states, did not benefit from interstate migration to the same degree (Western Australia's population growth outpaced the rest of the nation in the twelve months to June 2007).
While Western Australia as a whole and regional Western Australia enjoyed population growth between 1996-2006, this growth was restricted to less than half of the regional LGAs. Of the 112 LGAs in regional Western Australia, 53 grew in population between 1996-2006, while 59 declined.
The demographic makeup of Western Australia has undergone significant change since the 1970's, particularly in family structure and household size and these changes have influenced the housing requirements of the state. Western Australia's median age has increased from 27 years in 1976 to 36 years in 2006. While the total population has increased 71% between 1976-2006, the number of children (aged less than 18 years) only increased 23%. Households containing five or more persons have declined from 23% of all households in 1976 to 10% at the last Census (2006). In 1976 slightly more than 37% of Western Australians lived in one or two person households, but by 1986 this figure had increased to 50%, and to 59% in 2006.
SETTLEMENT PATTERNS
From the 1960's onward a pattern of a declining rural population and an increasing urban population had been established in Western Australia. In 1976, 70% of Western Australians lived in the Perth metropolitan region and by 2006 Perth contained 74% of the state's population.
While Perth's share of the state population has continued to grow, there has been also been strong growth in coastal locations south of the metropolitan area, including Mandurah, Bunbury and the Busselton-Margaret River area and their surrounding regions.
This movement of population, often referred to as sea change, is part of a national trend and is often associated with a combination of retired persons and cheaper housing alternatives. While certain coastal areas have grown substantially there has been a general decline in many inland, rural areas. Traditional farming communities have especially witnessed declines in population, often leading to a loss of services and infrastructure.
In 2006 over one-quarter (26%) of Western Australia’s population resided outside of the Perth metropolitan area, with three-quarters of them located in over 170 urban centres or localities and the rest located in rural areas.
DWELLINGS
Between the 1996-2006 Censuses the number of occupied private dwellings in Western Australia grew 20%, from 629,303 in 1996 to 757,983 in 2006. Growth in occupied private dwellings was almost identical in Perth (21%) and regional Western Australia (20%). During the ten years to 2006 Western Australia’s population increased 15%. With the growth in dwelling numbers outpacing population growth the average household size in Western Australia fell from 2.7 persons in 1996 to 2.5 persons in 2006.
The number of unoccupied private dwellings in the state grew by considerably more than the number of occupied dwellings between the 1996-2006 Censuses (up 32%). In Perth unoccupied dwellings increased 26% and in regional Western Australia they rose 39%. The largest increases in unoccupied private dwellings (in numeric and proportional terms) were in the Shires of Capel (up 231 or 103%), Augusta-Margaret River (up 998 or 128%), Nannup (up 133 or 111%), Busselton (up 1,251 or 61%), Laverton (up 107 or 289%) and Leonora (up 149 or 324%). The City of Mandurah, despite containing the largest number of unoccupied dwellings in regional Western Australia (5,801), only increased 17% between 1996-2006. This reflected Mandurah's growing permanent population as it shifted from a holiday centre with 42% unoccupied stock in 1971 to an urban centre with 19% unoccupied dwellings in 2006 (25% in 1996).
DWELLING OCCUPANCY, By number of dwellings - Western Australia |
| |
| 1996 | 2001 | 2006 | Change 1996-2006 | |
| no. | no. | no. | % | |
OCCUPIED PRIVATE DWELLINGS | |
| |
| Perth(a) | 463 854 | 511 199 | 560 089 | 20.7 | |
| Regional Western Australia(b) | 165 449 | 184 450 | 197 902 | 19.6 | |
| Western Australia - Total | 629 303 | 695 649 | 757 991 | 20.4 | |
UNOCCUPIED PRIVATE DWELLINGS | |
| |
| Perth(a) | 38 477 | 40 807 | 48 648 | 26.4 | |
| Regional Western Australia(b) | 30 519 | 36 323 | 42 368 | 38.8 | |
| Western Australia - Total | 68 996 | 77 130 | 91 016 | 31.9 | |
| |
| (a) Perth Statistical Division |
| (b) Balance of state |
| 1996, 2001 and 2006 Census of Population and Housing. |
DWELLING STRUCTURE
At the 2006 Census there were 757,991 occupied private dwellings containing 1,885,143 persons in Western Australia. Perth accounted for 74% of these persons, leaving regional Western Australia with 197,902 occupied private dwellings containing 487,967 persons.
Western Australia's housing stock is predominantly separate houses, accounting for 81% of all occupied private dwellings in 2006. While Perth mirrors this tendency with 79% of occupied private dwellings being separate houses, the proportion of separate houses in regional Western Australia was higher at 86%. Medium to high density housing accounted for 18% of Western Australia's occupied private dwellings in 2006, but this was heavily influenced by Perth, with regional Western Australia having only 11% of their occupied private dwelling stock as medium to high density.
The major regional areas with medium to high density housing are predominantly in the north of the state. LGAs with significant tourism or mining activity dominate, with only Bunbury going against the trend.
EXTENT OF MEDIUM TO HIGH DENSITY HOUSING(a), By LGA - Western Australia - 2006 |
| |
| Proportion of total occupied private dwellings | |
| % | |
| |
| Roebourne (S) | 24.3 | |
| Bunbury (C) | 24.1 | |
| Geraldton (C) | 22.0 | |
| East Pilbara (S) | 19.6 | |
| Carnarvon (S) | 18.9 | |
| Laverton (S) | 18.4 | |
| Port Hedland (T) | 18.0 | |
| Kalgoorlie/Boulder (C) | 17.5 | |
| Mandurah (C) | 16.2 | |
| Wyndham-East Kimberley (S) | 16.0 | |
| Perth(b) | 20.3 | |
| Western Australia | 17.9 | |
| |
| (a) Comprises semi-detached houses, townhouses, flats, units and apartments. |
| (b) Perth Statistical Division. |
| 2006 Census of Population and Housing. |
At the 2006 Census just 0.8% of persons who usually resided in Western Australia were in 'other' dwellings such as caravans, cabins, houseboats, tents or flats attached to shops, etc. For Western Australia this was 8,051 such dwellings, housing 14,504 persons. This component of housing however was dominated by regional Western Australia, which accounted for 65% of 'other' dwellings and 68% of persons usually residing in such dwellings. The large proportion of people living in 'other' dwellings in regional Western Australia (mainly northern LGAs) is greatly influenced by a significant proportion of what are termed 'Grey Nomads' touring the north of the state and staying in 'other' dwellings during Census time.
PROPORTION OF USUAL RESIDENTS LIVING IN OTHER DWELLINGS(a), By LGA - Western Australia - 2006 |
| |
| Proportion of total usual residents | |
| % | |
| |
| Halls Creek (S) | 12.7 | |
| Shark Bay (S) | 12.2 | |
| Wiluna (S) | 11.8 | |
| Wyndham-East Kimberley (S) | 10.5 | |
| Broome (S) | 10.5 | |
| Yalgoo (S) | 10.2 | |
| Exmouth (S) | 10.1 | |
| Carnarvon (S) | 8.6 | |
| Upper Gascoyne (S) | 8.4 | |
| Nannup (S) | 7.4 | |
| Perth(b) | 0.7 | |
| Western Australia | 0.8 | |
| |
| (a) Comprises caravans, cabins, houseboats, tents or flats attached to shops, etc. |
| (b) Perth Statistical Division. |
| 2006 Census of Population and Housing. |
TENURE TYPE
At the 2006 Census regional Western Australia had a marginally higher proportion of occupied private dwellings that were fully owned, at 33%, than Perth with 32% (proportions exclude occupied dwellings where tenure was not stated). Regionally home ownership rates were highest in the Wheatbelt shires and lowest in the Pilbara.
In 2006 the proportion of houses that were fully owned in Western Australia had declined from a decade earlier, from 38% to 33%. The Perth and regional Western Australia proportions for dwellings fully owned changed at similar rates over the past ten years. While the proportion of fully owned dwellings is higher for regional Western Australia than Perth, the situation is reversed for dwellings being purchased. At the 2006 Census 41% of occupied private dwellings in Perth were being purchased as opposed to 32% in regional Western Australia.
There was a greater proportion of dwellings being rented (among occupied private dwellings) in regional Western Australia (33%) than in Perth (26%) in 2006. Remote LGAs such as Ngaanyatjarraku, Halls Creek, Derby-West Kimberley and Ashburton all recorded over three-quarters of their usual residents living in rented dwellings. Much of this can be attributed to a larger component of public and community housing associated with Indigenous housing programs in remote communities. At the other extreme Wheatbelt shires reported low proportions of persons residing in rented dwellings, with Narrogin, Chittering, Cuballing and Woodanilling all under 10%.
PROPORTION OF USUAL RESIDENTS LIVING IN RENTED DWELLINGS, By LGA - Western Australia - 2006 |
| |
| HIGHEST | Proportion of total usual residents (%) | | LOWEST | Proportion of total usual residents (%) | |
| |
| Ngaanyatjarraku (S) | 91.4 | | Narrogin (S) | 8.9 | |
| Halls Creek (S) | 80.7 | | Chittering (S) | 9.2 | |
| Derby-West Kimberley (S) | 77.4 | | Cuballing (S) | 9.4 | |
| Ashburton (S) | 76.3 | | Woodanilling (S) | 9.7 | |
| Laverton (S) | 74.7 | | Wandering (S) | 10.6 | |
| Upper Gascoyne (S) | 69.8 | | Serpentine-Jarrahdale (S) | 10.8 | |
| Wyndham-East Kimberley (S) | 60.3 | | Westonia (S) | 11.2 | |
| Menzies (S) | 58.9 | | Mundaring (S) | 11.7 | |
| Roebourne (S) | 57.9 | | Tammin (S) | 11.9 | |
| Broome (S) | 54.3 | | Northam (S) | 12.2 | |
| |
| 2006 Census of Population and Housing. |
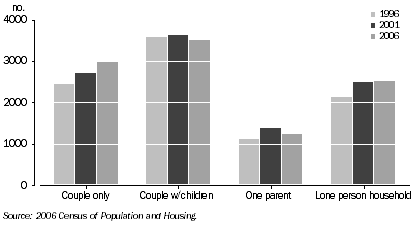
HOUSEHOLD TYPES
The distribution of household types in regional Western Australia in 2006 closely matched that in Perth, with single family households (includes two parent, single parent and couple only families) occupying approximately two-thirds of private dwellings and roughly a quarter occupied by lone person households. The remainder were in multiple family or group households.
Regional LGAs that reported atypical household arrangements included Ngaanyatjarraku with 22% of occupied private dwellings having two or more families residing in the dwelling, along with Halls Creek and Wiluna (9%) and Derby-West Kimberley (5%). Capel had the highest proportion of single family households (82%) as well as a low proportion of lone person households (12%).
Regional Western Australia (42%) had a higher proportion of couple families with no children than Perth, (37%) and slightly lower proportions of couple families with children (43% to 46%) and one parent families (14% to 15%). Both Perth and regional Western Australia had 10% of persons residing in lone person households.
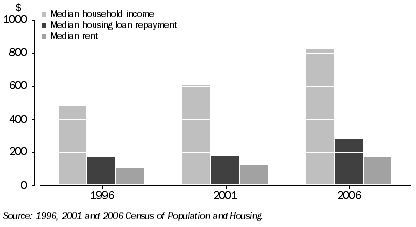
MONTHLY HOUSING LOAN REPAYMENTS AND RENTS
Census data shows that Western Australians living in regional areas have lower housing loan repayments and rents than their capital city counterparts. In 2006 the median monthly housing loan repayment in Western Australia was $1,213, up from $743 in 1996. This represents a rise of 63% over that decade. In that period the median household income rose 67%, from $635 to $1,063. Median weekly rents in Western Australia went from $110 in 1996 to $170 in 2006, up 55%.
For regional Western Australia the median monthly housing loan repayment was $1,083, 17% lower than the Perth median. Median weekly rents at the time of the 2006 Census were 28% higher in Perth ($180) than in regional Western Australia ($130). It is important to note however that median rent figures include a diverse range of rental arrangements, including private rental (renting from a real estate agent or private landlord), social (public and community housing) and employer provided housing, which may not necessarily reflect true market rent due to subsidised rent for the latter two categories.
INDIGENOUS HOUSING
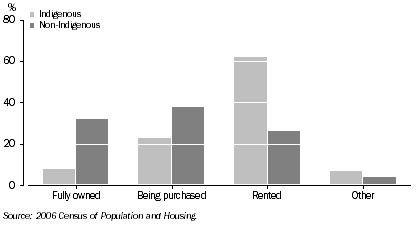
In 2006 the housing tenure of Indigenous Western Australians differed markedly from that of non-Indigenous Western Australians. A much greater proportion (32%) of households without Indigenous Western Australians fully owned their dwellings, compared to Indigenous households (8%). The situation is more comparable for those households purchasing their dwellings, with 23% of Indigenous households and 38% of non-Indigenous households having this tenure type. Indigenous households were more likely to be renting, with 62% having that tenure type, opposed to 26% for non-Indigenous households. For those households renting, 60% of Indigenous households did so from a state housing authority, a housing cooperative or a church group, while 85% of non-Indigenous households that rent did so privately.
PROPORTION OF INDIGENOUS AND NON-INDIGENOUS PERSONS LIVING IN OCCUPIED PRIVATE DWELLINGS, By tenure type, Western Australia, 2006
HOUSING FINANCE
Nationally about two-thirds of housing finance commitments are for owner occupation with the remainder for investment housing. Housing finance for owner occupation in Western Australia is dominated by the purchase of established dwellings. Between August 1996-2006 over 750,000 dwellings were purchased, either as construction, new dwellings or established dwellings. Established dwellings accounted for 83% of this figure (645,620) with construction dwellings contributing 14% (109,279) and new dwellings 3% (23,020). The average amount financed by these three types of dwellings has remained comparable over the decade, though purchases of established dwellings did not rise to the same extent. The average amount for refinancing of established dwellings kept pace during this period.
AVERAGE LOAN SIZE FOR OWNER OCCUPIED HOUSING, Western Australia |
| |
| August 1996 | August 2001 | August 2006 | |
| $ | $ | $ | |
| |
| Construction of dwellings | 91 000 | 131 800 | 240 200 | |
| Purchase of new dwellings | 93 600 | 135 800 | 241 200 | |
| Purchase of established dwellings | 97 500 | 122 000 | 212 500 | |
| Refinancing of established dwellings | 89 700 | 101 500 | 182 600 | |
| |
| Housing Finance, Australia, cat. no. 5609.0. |
The number of housing finance commitments for owner occupation in Western Australia was relatively flat between 1996-2000 before experiencing a 9% increase in 2001 and maintaining this level in 2002. The number of commitments jumped again in 2003 (up 13%) and remained at that level for 2004. Another jump occurred in 2005 (up 16%), followed by a 13% increase in 2006. While numbers of commitments grew at a staggered rate, the value of those commitments grew slowly at first but accelerated from around mid-2004, growing at a faster rate than the number of commitments.
TOTAL VALUE OF HOUSING FINANCE FOR OWNER OCCUPATION, Western Australia
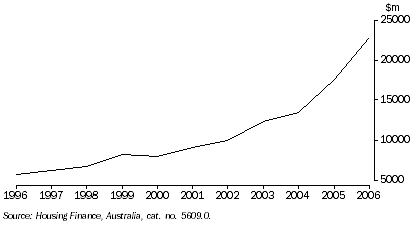
Between 1996-2006, 848,454 housing finance commitments were made by owner occupiers in Western Australia, for a total value of over $120 billion.
According to the Real Estate Institute of Western Australia, first home buyer finance commitments between 1996-2006 showed a high degree of volatility, much of which can be explained by affordability pressures and/or policy influences. The dip in commitments into 2000 and subsequent rapid rise, reflected the effects of the introduction of the GST and the introduction of the $7,000 First Home Buyers Grant in July 2000 which was subsequently increased to $14,000, for a period from March 2001. Likewise housing affordability drove down approvals until the State Government offered stamp duty relief in mid-2004.
FIRST HOME BUYERS, Number of housing finance commitments (owner occupation), Western Australia
 NON-FIRST HOME BUYERS,
 Number of housing finance commitments (owner occupation), Western Australia
SELECTED REGIONAL ANALYSIS
Western Australia comprises 142 Local Government Areas (LGAs), 30 of these within the Perth Statistical Division. Additionally the ABS recognises 65 urban centres with 14 of these in the Perth metropolitan area. This regional housing analysis will look at 11 areas outside of Perth, most of which have shown strong growth between the 1996-2006 Censuses. It will examine a range of variables including Census counts of population and housing, building approvals and house, unit and land sales. For the non-Census variables the period covered is 1996-2006 inclusive. Real Estate Institute of Western Australia (REIWA) data on regional housing and land sales has also been used. For comparison Perth’s median house price figures for the respective Census years were $128,000 in 1996, $173,000 in 2001 and $410,000 in 2006. Where there are disconnects between geographies the most reasonable approximation is used and noted.
The areas selected for analysis are diverse geographically, economically and in classification terms. They were chosen because of their significance in housing terms, as well as their spread around the state. Below is a description of the geographic areas highlighted in this article in terms of their relationship to the 2006 Australian Standard Geographic Classification (ABS cat. no. 1216.0).
- Albany, which is the City of Albany.
- Avon Arc is a REIWA defined region which comprises the Shires of Beverley, Chittering, Toodyay, York and Northam and the Town of Northam (which now incorporates the Town and Shires of Northam that amalgamated in July 2007). Building approvals data covers all the LGAs listed above.
- Broome, which is the Shire of Broome.
- Bunbury is the Bunbury Statistical Subdivision which covers the LGAs of the City of Bunbury plus the Statistical Local Areas of Capel Part A, Dardanup Part A and Harvey Part A. Part As of the Shires of Capel, Dardanup and Harvey are the urban portions fringing the City of Bunbury. Building approvals data covers all of the LGAs listed above.
- Busselton, which is the Shire of Busselton.
- Dalwallinu, which is the Shire of Dalwallinu.
- Geraldton, which is covered by the Geraldton Statistical Subdivision. This comprises the City of Geraldton and the adjoining urban portion of the Shire of Greenough. These two LGAs were amalgamated in mid-2007 to form the City of Geraldton-Greenough. Building approvals data includes both LGAs. REIWA data is taken from their Regional Centres dataset, termed Geraldton-Greenough.
- Kalgoorlie is the Statistical Local Area of Kalgoorlie Part A which covers the urban portion of the City of Kalgoorlie/Boulder. It is referred to by REIWA as Kalgoorlie-Boulder. Building approvals data covers the entire LGA.
- Karratha is the Urban Centre of Karratha for both Census and REIWA data. Building approvals data covers the Shire of Roebourne, of which Karratha is part.
- Leonora, which is the Shire of Leonora.
- Mandurah is the Mandurah Statistical Subdivision which comprises the LGAs of the City of Mandurah and the Shire of Murray.
ALBANY
The City of Albany covers the former Town of Albany which amalgamated with the Shire of Albany in 1998. At the 2006 Census there were 31,575 usual residents, an increase of 15% since the 1996 Census. There were 12,058 occupied private dwellings reported in Albany in 2006, 20% more than in 1996.
In 1996 the median household weekly income in Albany was $475 and the median monthly housing loan repayment was $744. These figures in 2006 were $847 and $1,050 respectively, indicating a 78% rise in income but only a 41% rise in mortgage repayments. During that period median weekly rents increased 50%, from $100 to $150.
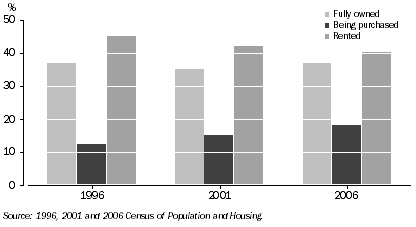
Separate houses dominated dwelling structure types in Albany in 2006, accounting for 87% of all occupied private dwellings. This proportion has remained virtually unchanged over the 1996-2006 period. The most common type of tenure in Albany was fully owned dwellings, which accounted for 38% of occupied private dwellings. Dwellings being purchased were the next most common at 31%, with 29% of dwellings rented. Since 1996 there has been an increase in the proportion of dwellings being purchased while dwellings fully owned have declined proportionally.
ALBANY, Tenure type of occupied private dwellings |
| |
| 1996 | 2001 | 2006 | |
| % | % | % | |
| |
| Fully owned | 45.9 | 43.1 | 38.1 | |
| Being purchased | 24.0 | 26.1 | 31.4 | |
| Rented | 29.0 | 29.5 | 29.4 | |
| Other | 1.1 | 1.2 | 1.1 | |
| |
| 1996, 2001 and 2006 Census of Population and Housing. |
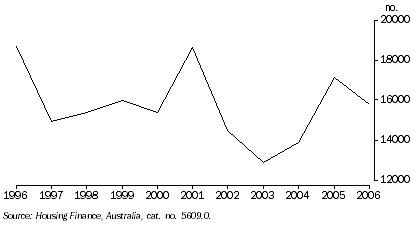
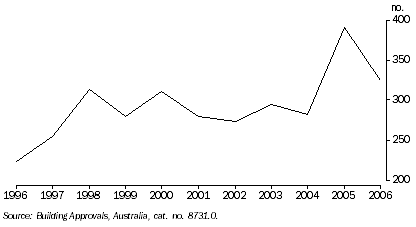
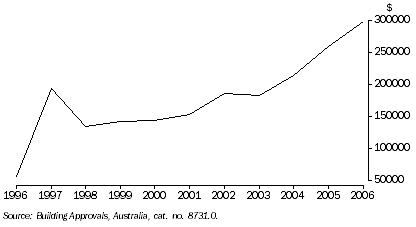
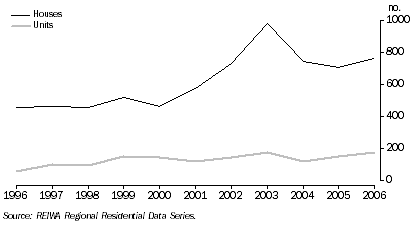
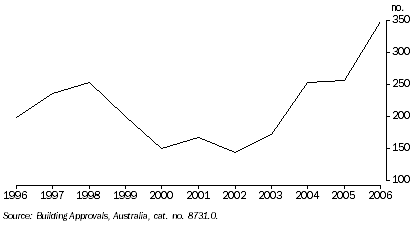
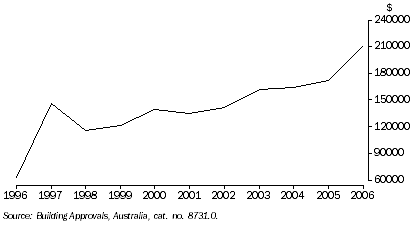
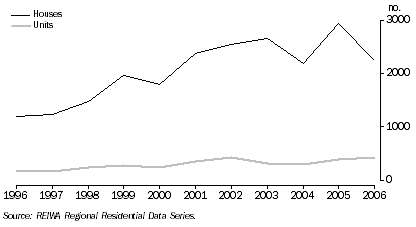
Between 1996-2006 there were 3,226 new house approvals for the City of Albany. There was an increase in approvals in 2005 and 2006 compared to previous years. The average value of new house approvals rose from just under $53,000 in 1996 to just over $215,000 in 2006. The largest annual rise in average value (up 29%) occurred in 2006.
ALBANY, Number of new house approvals
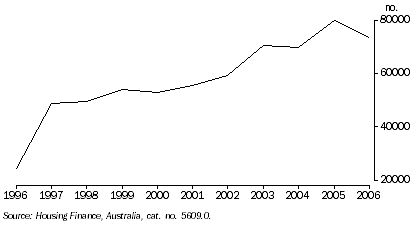
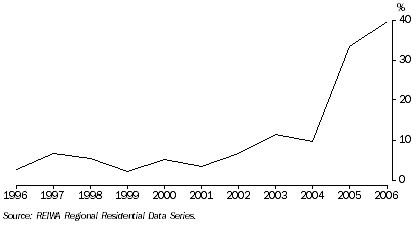
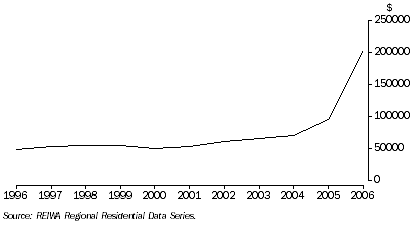
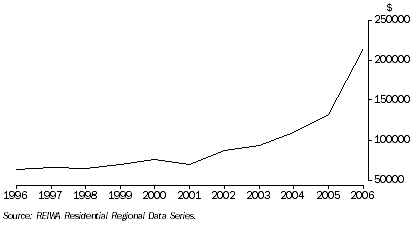
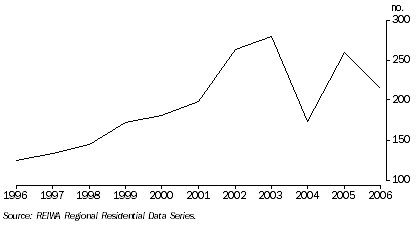
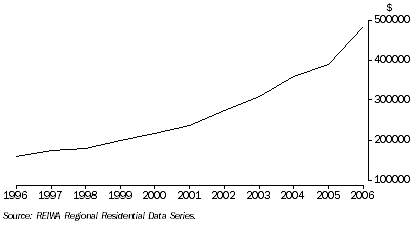
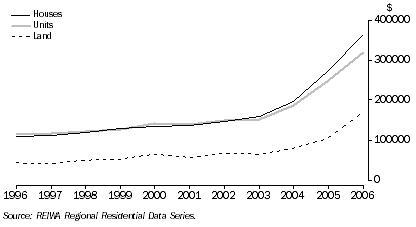
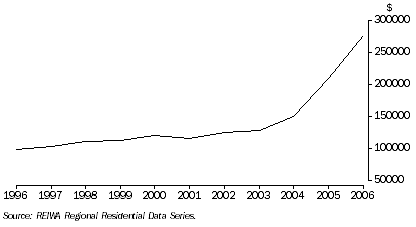
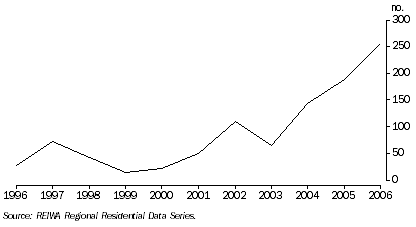
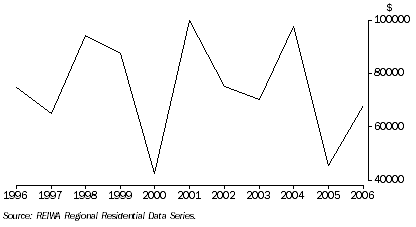
In the period 1996-2006 there were 8,034 sales of houses in Albany. The median house price more than tripled from $120,000 in 1996 to $363,000 in 2006. The bulk of this growth occurred in the most recent years with both 2005 and 2006 recording annual growth of well over 30%. Residential land sales recorded a dramatic upsurge at the end of the 1996-2006 period with the median residential land sale price, which had gone from $48,000 in 1996 to $95,000 in 2005, experiencing a 112% rise in 2006, to $201,500.
ALBANY, Change in the median price of house sales
 ALBANY,
 Median price of land sales
AVON ARC
The Avon Arc is the area wrapped around the northern and eastern boundaries of the Perth metropolitan region and comprises the LGAs of Northam Town and Shire and the Shires of Beverley, Chittering, Toodyay and York.
At the 2006 Census 22,110 persons were usual residents of Avon Arc, up 5% from the 21,046 at the 2001 Census, which in turn was 9% above the 1996 Census figure of 19,324 persons.
There were 8,156 occupied private dwellings reported in the Avon Arc at the 2006 Census with 40% fully owned, 38% being purchased and 18% rented. Separate houses accounted for 94% of these dwellings. The total number of dwellings in 2006 represented a 19% increase from 1996. Since 1996 there has been a change in the tenure type of dwellings with the proportion of fully owned dwellings declining from 47%, dwellings being purchased rising from 29% and rented dwellings falling from 24%.
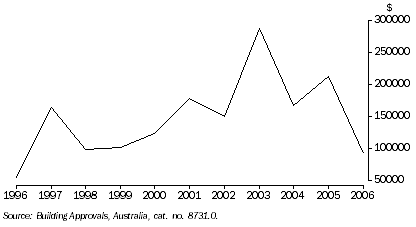
Between 1996-2006 there were 2,428 building approvals for new houses in the Avon Arc, with the number of approvals being steady in each year throughout the period. Over the same period, the value of approvals in the Avon Arc totalled more than $276 million, with the average value of approvals almost quadrupling from $40,911 in 1996 to $163,162 in 2006.
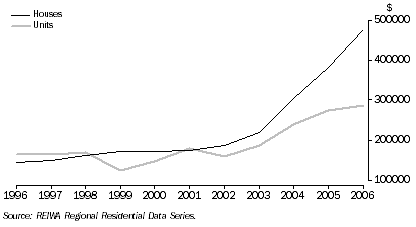
The Avon Arc has seen a surge in land and house sales since 2003 as the area offered affordable lifestyle opportunities in relative close proximity to Perth. The median house price for the area grew by a modest 11% over the 1996-2001 inter-censal period, 57% in the three years between 2001-2004 and by a very large 95% between 2004-2006. The growth in prices has not been confined to any one local authority within the Avon Arc area despite the large variation in median house prices between local authorities in 2006: Beverley ($199,000), Northam ($205,000), York ($270,000), Toodyay ($310,000) and Chittering ($380,000).
AVON ARC, Number of house sales
 AVON ARC,
 Median price of house sales
BROOME
As a tourist destination Broome's population and housing requirements is heavily influenced by non-residents. In 2006 there were 19,783 persons recorded in Broome on Census night, with only 59% (11,753) of them usual residents of the area. The remaining 41% (8,030) persons were visitors to the area. The bulk of these visitors (51%) came from Western Australia with a large number of persons also visiting from New South Wales (14% or 1,154) and overseas (8% or 617).
When looking at those counted in Broome on Census night there were a relatively high proportion of them residing in 'other' dwellings - caravans, cabins, houseboats, improvised homes, tents, sleepers out and houses or flats attached to shops, offices, etc. In 2006, 11% (1,171) of persons in occupied private dwellings in Broome were residing in 'other' dwellings, compared to the state average of just 1%.
In Broome, 37% of occupied private dwellings were fully owned in 2006, the same proportion as in 1996. Occupied private dwellings being purchased in Broome increased from 12% to 18% between 1996-2006, while the proportion of rented dwellings fell from 48% to 40%.
BROOME, Tenure type of occupied private dwellings
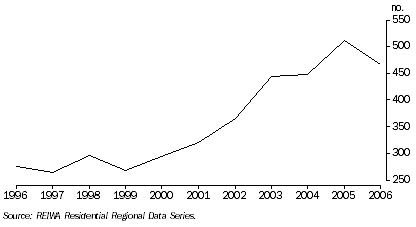
Building activity has been steady in Broome between 1996-2006 with 1,586 new building approvals valued at $282 million. The number of approvals has increased slowly over the decade, while average values of new house approvals have risen 438% in that time, from $55,387 in 1996 to $297,972 in 2006.
BROOME, Average value of new house approvals
Between 1996-2006 there were 2,145 house sales and 1,114 unit sales in Broome. Median house and unit prices both rose by an average of 11% per year over the period. Median house prices had a standout year in 2006 with an increase of 24%, while prices of units grew 26% in both 2003 and 2006. The average house price in Broome increased from $166,612 in 1996 to $556,052 in 2006 and the average unit price went from $132,873 to $424,480. The median prices for both house ($160,000) and unit ($128,000) sales in Broome began at similar levels to their average prices in 1996. By 2006 however the median price of house ($482,500) and unit ($362,000) sales were significantly lower than their average prices, reflecting larger price increases in the property valued at the higher end of the market. A limited supply of residential land in Broome, initially due to native title claims, may well have contributed to this strong growth in house prices as well as higher building costs in the state’s north west.
BROOME, Number of house sales
 BROOME,
 Median price of house sales
BUNBURY
The Bunbury Statistical Subdivision consists of the City of Bunbury and parts of the adjoining Shires of Harvey, Dardanup and Capel. In 2006 it had a population of 54,967 persons comprising 29,702 persons in the City of Bunbury, 11,537 persons in the Shire of Harvey, 7,720 persons in the Shire of Dardanup and 6,011 persons in the Shire of Capel. This total population has grown by one-third since 1996, with the vast majority of that growth occurring in the three shires adjoining the City of Bunbury. Between 1996-2006 the population of the City of Bunbury only increased by around 3,000 persons while the adjoining three shires recorded population growth of over 10,000 persons.
A large number of usual residents of Bunbury lived in separate houses in 2006 (44,683 persons in 16,358 dwellings). The rest lived in semi-detached, row or terrace houses, townhouses, etc (3,310 persons in 1,904 dwellings); flats, units or apartments (1,488 persons in 951 dwellings); and 'other' dwellings (379 persons in 233 dwellings). These proportions remained fairly steady between 1996-2006.
For all occupied private dwellings in Bunbury in 2006, 30% were fully owned, 41% were being purchased and 29% were rented. This contrasts with 1996 which showed a higher proportion of fully owned (35%) and rented (32%) dwellings, but a lower proportion of dwellings being purchased (33%).
Between 1996-2006 there were 10,312 new houses approved at a total value of over $1.3 billion for the LGAs covered in Bunbury Urban (i.e. the City of Bunbury and the Shires of Capel, Dardanup and Harvey combined). Approvals have grown at their strongest rate during the period 2004-2006, averaging almost 1,246 approvals per year. The average value of approvals was $44,026 in 1996 which almost trebled to $130,990 in 1997. Since then it has increased to just under $200,000 in 2006, with growth of around 20% in each of the two latest years.
House, unit and land sales have been strong in Bunbury. The REIWA region of Greater Bunbury has seen over 14,000 house sales, just under 1,800 unit sales and just over 9,000 land sales between 1996-2006.
BUNBURY, Sales of houses, units and land
The median price of house sales in Greater Bunbury rose from $108,000 in 1996 to $365,000 in 2006 (up 238%), while unit sales prices went from $114,000 to $320,000 (up 181%) over the same period. Residential land sales in Greater Bunbury rose from a median price of $43,500 in 1996 to $170,000 in 2006, with the most recent years exhibiting very strong growth: 21% in 2004, 34% in 2005 and 61% in 2006. The very strong house price growth in Greater Bunbury between 2003-2006 subsided in the latter half of 2006, as the market returned to a more sustainable pattern of prices growth.
BUNBURY, Median price of house, unit and land sales
BUSSELTON
In August 2006 the Shire of Busselton had 25,355 usual residents, an increase of 45% from 1996 (17,444). This growth in population was supported by a commensurate increase in housing stock over that period. In terms of occupied private dwellings, the number of separate houses rose from 6,538 in 1996 to 9,550 in 2006 (up 46%). Medium density housing of semi-detached, row or terrace house, townhouses etc. rose from 475 dwellings in 1996 to 575 dwellings in 2006, while high density housing of flats, units and apartments fell from 355 to 243 over the decade. There was a slight increase in 'other' dwellings from 271 to 304 over the period, including caravans and houseboats.
In 2006, 88% of occupied private dwellings in Busselton were separate houses, up from 82% in 1996. The tenure type of separate houses was evenly divided between being fully owned, being purchased and rented. While the proportion of rented dwellings remained similar to 1996 there was a marked shift in the ownership categories of fully owned (down from 43%) and being purchased (up from 22%). Monthly housing loan repayments increased significantly in Busselton between 1996-2006. In 1996, 56% of monthly housing loan repayments were between $400-$949 with a median of $604, whereas in 2006 the median monthly housing loan repayment was $1,213 and the median monthly rent was $780. Over that same period the median monthly household income went from $1,937 to $4,160.
Between 1996-2006 there 5,845 new house approvals in Busselton to a total value of $935 million. The average value of approvals rose from $46,688 in 1996 to $257,797 in 2006, an increase of 452%.
Real estate activity has been strong in Busselton in the period 1996-2006. House sales grew steadily between 1996-2000 at around 470 houses per year, but then increased to 573 sales in 2001, 727 sales in 2002 and 978 sales in 2003. House sales then eased to 739 (2004), 700 (2005) and 758 (2006). The median price of Busselton houses rose gradually in the years 1996-2002, from $145,00 to $188,000, and then began to accelerate, increasing 26% per year on average over the next four years, finishing at a median price of $475,000 in 2006.
BUSSELTON, Sales of houses and units
 BUSSELTON,
 Median price of house and unit sales
Busselton has also experienced an increase in sales of units between 1999-2006, averaging 146 sales per year. The median price of units sold in 1996 was $165,500, $190,000 lower than the median price of house sales in that year. The median price of house sales rose to $285,000 by 2006, with the price of unit sales only $20,000 lower. Between 1996-2006 almost 5,000 sales of land were made in Busselton, from a median price of $71,250 in 1996 to $233,500 in 2006.
DALWALLINU
While coastal and mining related regions of the state in general showed growing populations over the last ten years, this was not always the case for inland agricultural areas. A good example is the Shire of Dalwallinu.
Between 1996-2006 the demography of Dalwallinu changed significantly. The median age increased from 30 to 36 years. The number of children attending school declined by more than a third from 353 children in 1996 (267 primary students and 86 secondary students) to 224 children in 2006 (150 primary students and 74 secondary students). In 1996 occupied private dwellings in Dalwallinu mainly housed couple families with children (44%), couple only families (21%) and lone person households (19%). By 2006 the proportion of couple families with children fell to 39% due to increases in couple only families (33%) and lone person households (23%). Dalwallinu's median weekly household income did not keep pace with growth at the state level. In 1996 Dalwallinu had median weekly household income of $623, 98% of the Western Australian figure of $635. By 2006 Dalwallinu's median weekly household income had increased to $967, 91% of the state figure of $1,063.
In 1996 Dalwallinu had a population of 1,706 persons and 566 occupied private dwellings. By 2006 these figures had fallen to 1,369 persons and 509 occupied private dwellings. The average household size in Dalwallinu fell from 3.0 persons in 1996 to 2.7 persons in 2006. In 1996 just over half of these dwellings (52%) were fully owned, 16% were being purchased and 31% rented. In 2006 the proportion of dwellings fully owned fell to 47%, dwellings being purchased rose to 23% and rented dwellings fell marginally to 30%.
Real estate activity in the Shire of Dalwallinu was extremely flat between 1996-2006, with only 235 house sales in total, at an average of 21 sales per year. The median price of house sales rose 95% over the period, from $40,100 to $78,000, and the average price of houses rose by a lesser 73%, from $46,126 to $79,594. Between 1996-2006 there were 59 sales of residential land valued at $561,604 in total.
There were only 62 houses approved for construction in Dalwallinu valued at over $7.5 million in the period 1996-2006. Average values of houses showed considerably fluctuation over the last ten years despite the 2006 figure being only slightly higher the 1996 figure.
DALWALLINU, Average value of new house approvals
GERALDTON
The Geraldton Statistical Subdivision (SSD) includes the City of Geraldton and the surrounding urban area which is part of the Shire of Greenough. On the night of the 2006 Census Geraldton SSD had a usual resident population of 31,553 persons, representing an 11% increase from the 1996 Census. Of all usual residents in the Geraldton SSD, 27,887 were housed in 10,890 private dwellings, of which 84% (9,144) were separate houses.
The median age of Geraldton SSD residents increased from 31 to 35 years between 1996-2006. The median weekly household income in Geraldton SSD in 2006 was $958, 66% higher than the median weekly household income in 1996. The median weekly housing loan repayment in Geraldton SSD was $242 in 2006, 49% higher than in 1996. Rents had increased 40% over the same period, rising from a median weekly figure of $100 to $140.
There was significant change in the composition of families in the Geraldton SSD based on place of enumeration Census data. Between 1996-2006 there were large increases in occupied private dwellings containing couple families with no children (up 23%) and lone person households (up 18%), while dwellings with couple families with children declined 3%.
GERALDTON, Family composition of occupied private dwellings
The proportion of dwellings fully owned and rented in the Geraldton SSD declined equally between 1996-2006, from 35% to 32%, while the proportion of dwellings being purchased increased from 30% to 36%. The mix of housing types changed between 1996-2006. The proportion of separate houses increased from 81% to 83%, medium density housing (i.e. semi-detached houses and townhouses) fell from a proportion of 10% to 5% and the proportion of high density housing (i.e. flats and apartments) rose from 5% to 9%.
Between 1996-2006, 2,371 new houses were approved for construction in the LGAs of Geraldton and Greenough. Approvals in the City of Geraldton have been relatively stagnant at around 50 per year whereas approvals in the Shire of Greenough have been higher and increasing in recent years, as it accommodates for most of the population growth in the area.
GERALDTON AND GREENOUGH, Number of new house approvals
 GERALDTON AND GREENOUGH,
 Average value of new house approvals
Between 1996-2006 there were 8,189 houses sold in Geraldton/Greenough. Both the average and median price of these houses fluctuated over the period but were substantially higher in 2006 than in 1996. The median price in 1996 ($98,000) grew by a modest 18% in the five years to 2001 ($115,500), but then increased 138% to $275,000 in the five years to 2006. The strongest growth in median house prices was recorded in 2004 (up 17%), 2005 (up 39%) and 2006 (up 32%).
GERALDTON/GREENOUGH, Median price of house sales
Land sales were strong in Geraldton/Greenough between 1996-2006 with 3,437 sales at a total cost of almost $289 million. Between 1996-2004 the median price of land grew from $43,000 to $61,000, an increase of 42%. In the next two years however median land prices surged 49% in 2005 and 52% in 2006 to $125,000 in 2006. This represents an overall increase of 191% between 1996-2006.
GERALDTON/GREENOUGH, Sales of houses, units and land
KALGOORLIE
The urban part of the City of Kalgoorlie/Boulder recorded 28,241 usual residents at the time of the 2006 Census, similar to the number ten years earlier. Separate houses dominated the dwelling stock of Kalgoorlie, accounting for 90% of all occupied private dwellings.
Between the 1996-2006 Censuses Kalgoorlie experienced large increases in both incomes and housing costs. The median weekly household income increased 157%, from $589 to $1,512, and the median monthly housing loan repayment rose 233%, from $360 to $1,200. Despite these increases median weekly rents increased only 13%, from $150 to $170.
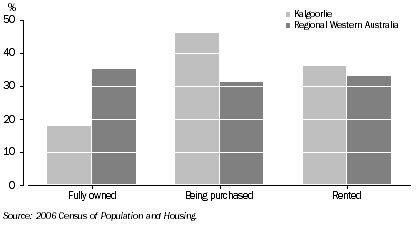
Tenure types are different in Kalgoorlie to those generally found in other parts of regional Western Australia. In 2006 the proportion of fully owned dwellings in Kalgoorlie (18%) was much less than the proportion found across regional Western Australia (33%). However there was a much larger proportion of dwellings being purchased in Kalgoorlie than in regional Western Australia. The proportions of rented dwellings did not differ significantly.
KALGOORLIE AND REGIONAL WESTERN AUSTRALIA, Tenure type of occupied private dwellings, 2006
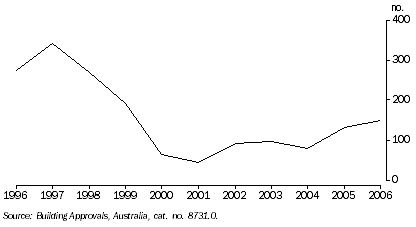
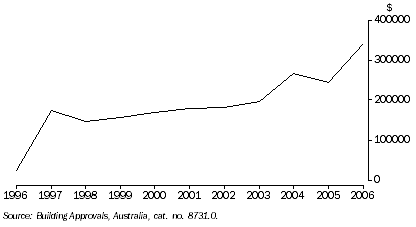
Building approvals for new houses in the City of Kalgoorlie/Boulder totalled 1,733 between 1996-2006. The number of approvals were inconsistent from year-to-year with a peak in house approvals of 342 in 1997 (342), a large decline to 44 approvals in 2001, followed by a gradual rise to 150 approvals in 2006. The total value of house approvals was a little over $238 million over the ten year period, with the average value of house approvals rising 516% from $38,909 in 1996 to $239,645 in 2006.
KALGOORLIE/BOULDER, Number of new house approvals
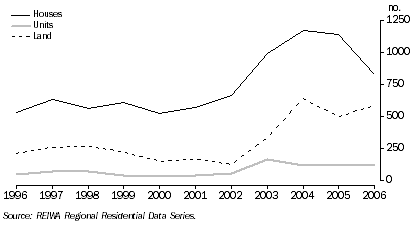
Between 1996-2006 there were over 11,000 house sales in Kalgoorlie-Boulder and 1,371 unit sales, with the volume of sales heavily weighted toward the most recent years. For house sales the years 1996-2002 averaged 788 sales per year, while between 2003-2006 the average was 1,389 house sales per year. For unit sales the comparable figures were 91 sales and 183 sales. Land sales defied this pattern being strongest in the years 1996-1998.
The increase in median sales prices were stronger for houses than for units between 1996-2006, from $138,000 to $225,000 for houses and $132,000 to $178,00 for unit sales.
KARRATHA
Karratha is the largest town in the Shire of Roebourne and at the 2006 Census had a usual resident population of 11,725. This was an increase of 9% from the 2001 Census and a 17% increase from the 1996 Census. The median age of residents of Karratha was 30 years in 2006, 6 years younger than the Western Australian median age of 36 years.
At the time of the 2006 Census 84% of Karratha residents were housed in private dwellings. The occupied private dwelling count was 3,401, comprising 2,441 separate houses, 632 semi-detached/row/townhouses, 119 flats/units/apartments and 209 'other' dwellings. Compared to 2001 the number of separate houses grew only marginally, but there was nearly a trebling of flats/units/apartments, up from 41 in 2001 to 119 in 2006.
There was a jump in the proportion of private dwellings being rented in Karratha in 2006 while dwellings fully owned or being purchased declined slightly. The high proportion of rental households is attributed to a very high level of employer provided housing for both the resource sector and government employees.
KARRATHA, Tenure type of occupied private dwellings |
| |
| 1996 | 2001 | 2006 | |
| % | % | % | |
| |
| Fully owned | 10.9 | 12.6 | 10.2 | |
| Being purchased | 25.6 | 25.3 | 24.8 | |
| Rented | 58.0 | 55.7 | 62.0 | |
| Other | 5.5 | 6.4 | 3.0 | |
| |
| 1996, 2001 and 2006 Census of Population and Housing. |
Between 1996-2006, 917 new house approvals were made in the Shire of Roebourne, of which Karratha is the major centre. The annual number of approvals fluctuated over the period from a high of 161 in 1997 to a low of 22 in 1999. In the period 2005-2006 approvals were strong at 133 and 130 respectively. The average value of new housing approvals in Roebourne has increased substantially from $23,661 in 1996 to $340,197 in 2006.
ROEBOURNE, Average value of new house approvals
From 1996-2006 there were 2,640 sales of houses in Karratha with the median price rising from $142,500 to $475,000. Growth in median house prices was strong in 2005 (31%) and 2006 (43%). There were 533 unit sales in Karratha between 1996-2006 with the median price of units increasing by less than houses, from $122,500 to $315,000. Between 1996-2006, 996 residential lots of land were sold in Karratha, with more than half sold between 2004-2006 (589).
KARRATHA, Number of land sales
LEONORA
In 2006 there were 1,412 usual residents of Leonora and 473 occupied private dwellings, a notable decline from 1996 - 2,683 usual residents and 591 occupied private dwellings. In 2006 however a large proportion of dwellings were listed as unoccupied (29%). On Census night 2006, 44% (1,033) of the people counted in the Shire were visitors. In 1996 a lesser proportion of 32% (1,129) were counted as visitors in Leonora.
Between 1996-2006 there were 150 house sales in Leonora valued at over $15 million. There was minimal fluctuation in the average price of house sales between 1996-2006, rising from $78,114 to $81,088. The median house price actually fell over the period, from $74,750 in 1996 to $68,000 in 2006. From 1996-2006 there were just 24 building approvals for new houses in Leonora.
LEONORA, Median price of house sales
MANDURAH
In 2006 the usual resident population of the Mandurah Statistical Subdivision (including the City of Mandurah and the Shire of Murray) was just under 68,000, 40% higher than a decade earlier (just over 48,000 in 1996). This rise occurred steadily over the period, with the population rising 18% between the 1996-2001 Censuses and 19% between the 2001-2006 Censuses.
Allied to strong population growth was a substantial increase in Mandurah's housing stock. The number of private dwellings rose from just over 18,000 in 1996 to just under 27,000 in 2006, a 48% increase. Growth was steady between 1996-2006, recording a 21% rise between both inter-censal periods.
The median age (based on place of enumeration counts) rose from 36 to 42 years and the average household size fell from 2.6 to 2.4 between 1996-2006.
Income and housing expenditure data from the 1996 and 2006 Censuses reveals a rise in median weekly household incomes (up 72% to $822), median monthly housing loan repayments (up 62% to $1,200) and median weekly rents (up 62% to $170).
MANDURAH, Median weekly household income and housing costs
The proportion of fully owned private dwellings in Mandurah fell between 1996-2006, from 42% to 37%, as dwellings being purchased increased from 31% to 33%. The vast majority of Mandurah residents live in separate dwellings (84%), although the number of flats/units/apartments almost tripled between 1996-2006, from 566 to 1,611. Separate houses in Mandurah were equally fully owned or being purchased (37% for each), while flats/units/apartments were predominantly rented (54%).
In the decade 1996-2006, 22,588 established houses were sold in Mandurah. The median price of these houses rose from $110,000 in 1996 to $135,000 in 2001 (an average annual increase of 3.5%). From 2002 the median price of established houses increased rapidly, averaging 20% annually to a median price of $410,000 in 2006. Unit sales in Mandurah displayed a similar pattern with the median price of unit sales rising 2.6% per year between 1996-2001 and 19.3% per year between 2002-2006 (on average). The median price of units rose from $94,000 in 1996 to $318,000 in 2006.
MANDURAH, Sales of houses and units
 MANDURAH,
 Median price of house and unit sales
Sales of land in Mandurah totalled just over 15,000 lots between 1996-2006, with strong growth experienced from 2002 onwards.
Between 1996-2006 just under 12,000 new houses were approved for construction in Mandurah. Growth in house approvals increased steadily over the period, almost tripling from 596 to 1,648 approvals. Coupled with this increase was a dramatic escalation in the total value of house approvals in Mandurah, from over $28 million in 1996 to $355 million in 2006.
MANDURAH, Total value of new house approvals
The average value of Mandurah's new house approvals rose from $47,434 in 1996 to $215,495 in 2006. The level in 2006 ($215,495) ranked behind 33 other regional LGAs in Western Australia, with predominantly remote Shires leading the way (e.g. Port Hedland, Wiluna and Halls Creek).
FURTHER DATA
The base data used in this feature article is at LGA level and is available as a spreadsheet which can be obtained by contacting either Phil Smythe of the Australian Bureau of Statistics at phil.smythe@abs.gov.au or Stewart Darby of the Real Estate Institute of Western Australia at stewart.darby@reiwa.com.au.
 Print Page
 Print All