Feature Article - Changes in types of employment
This article was published in the October 2004 issue of Australian Labour Market Statistics (cat. no. 6105.0).
CHANGES IN TYPES OF EMPLOYMENT IN AUSTRALIA, 1992-2003
INTRODUCTION
The nature of employment has been changing in Australia over the past few decades, with considerable attention given to the rise in part-time and 'casual' employment. Related issues of interest are changes in the types of benefits for employees, such as leave entitlements, and the extent of self-employment. However, there has been little data available on changes in the types of employment in Australia over time.
This article presents a time series on the types of employment that people have, including employees who are not entitled to paid sick or holiday leave, and people who own and manage their own business. Estimates are shown for 1992 to 2003, the period for which data are available on a consistent, annual basis. The series are constructed using data from the Labour Force Survey (LFS) and the Survey of Employee Earnings and Benefits, conducted as a supplement to the August LFS each year.
TYPES OF EMPLOYMENT IDENTIFIED IN THIS ARTICLE
The series presented in this article are for the following types of employment:
employee (not an owner manager of an incorporated enterprise)*
employee with paid leave entitlements
employee without paid leave entitlements
owner manager
owner manager of an incorporated enterprise*
owner manager of an unincorporated enterprise
contributing family worker
* together these groups comprise the 'employees' category in the Status in Employment classification.
These categories are similar to those in other classifications previously published by the ABS. Some key features are outlined below, while more detail can be found in Appendix 1 at the end of this article.
Owner managers of incorporated enterprises
The ABS publishes estimates of employed people from the LFS on a monthly basis classified by Status in Employment. This classification has the following mutually exclusive categories: employee; employer; own account worker; and contributing family worker (see the Glossary for more detail).
The Status in Employment classification treats people operating their own limited liability (incorporated) businesses as employees, reflecting their legal status. This is consistent with the concept of employees used in the System of National Accounts.
While this concept of employees may be appropriate from an economic perspective, for other uses there is value in separating owner managers of incorporated enterprises from other employees. Owner managers of incorporated enterprises generally have greater autonomy and authority over their business and employment conditions than other employees, and are usually able to set their own conditions, hours and pay (subject to the earnings of the business and other factors).
Employees without paid leave entitlements
There is interest in employees without paid leave entitlements, as paid sick and holiday leave contributes to the benefits a person can obtain from employment, and is a key indicator of an ongoing employment arrangement. While employees without paid leave entitlements should not necessarily be seen as being in 'casual' or unstable employment, changes in this indicator are still of considerable interest in showing changes in the Australian labour market.
Some indication of the relationship between casual employment and paid leave entitlements can be found through analysis of the results of surveys that included a question on whether an employee considered their job to be casual. Results from the Forms of Employment Survey in November 2001 showed that there is considerable overlap between the two populations: 86% of self-identified casuals did not have paid leave entitlements, and 89% of employees without paid leave entitlements were self-identified casuals.
Casual employment is often associated with short-term employment with hours varying from week to week. However, data from the Forms of Employment Survey indicate that this is not necessarily the case. In November 2001, 37% of employees who considered their jobs to be casual had been with their employer for 2 years or more, 76% expected to be with their current employer in 12 months, and 43% had earnings that did not vary from month to month.
In this article, 'employees with paid leave entitlements' refers to employees (excluding owner managers of incorporated enterprises) who have access to paid sick leave, or paid holiday leave, or both paid sick leave and paid holiday leave. 'Employees without paid leave entitlements' refers to all other employees (excluding owner managers of incorporated enterprises).
METHODOLOGY
The series presented in this article have been derived from combining data from both the Labour Force Survey and the Survey of Employee Earnings and Benefits in August of each year from 1992 to 2003.
The Labour Force Survey provides the core series on the labour force and is released monthly. It includes the Status in Employment classification. In addition, questions in the LFS can be used to identify owner managers of incorporated enterprises, although these questions were not specifically designed for this purpose and it is thought that this results in an undercount of between 5% and 10%. Data based on these questions will be used here, but their limitations should be taken into account when interpreting the results.
Firstly, the LFS is used to provide estimates of employees (excluding owner managers of incorporated enterprises), owner managers of both incorporated and unincorporated enterprises, and contributing family workers.
Employees (excluding owner managers of incorporated enterprises) are then apportioned to 'employees with paid leave entitlements' and 'employees without paid leave entitlements' using information from the Survey of Employee Earnings and Benefits, conducted each August on a subset of the LFS sample. The scope of this survey is restricted to employees, so it cannot provide estimates for all types of employment. However, it is the only annual source of data on whether employees are entitled to paid sick and holiday leave.
The two surveys and the methodology used are described in more detail in Appendix 2 at the end of this article.
CHANGES IN TYPES OF EMPLOYMENT
Summary
The table below shows how the types of employment have changed for people in Australia between 1992 and 2003.
Employed persons, Distribution by type of employment - 1992 to 2003 |
|  |
| | Employees with paid leave entitlements(a) | Employees without paid leave entitlements(a) | Owner managers of incorporated enterprises | Owner managers of unincorporated enterprises | Contributing family workers | Total | Total | |
| Month | % | % | % | % | % | % | '000 | |
| |
| August | | | | | | | | |
| 1992 | 62.0 | 16.9 | 4.9 | 15.2 | 1.0 | 100.0 | 7,636.7 | |
| 1993 | 61.8 | 17.1 | 4.6 | 15.6 | 0.9 | 100.0 | 7,636.3 | |
| 1994 | 61.0 | 17.8 | 5.1 | 15.0 | 1.0 | 100.0 | 7,897.4 | |
| 1995 | 61.2 | 18.0 | 5.2 | 14.7 | 0.9 | 100.0 | 8,231.3 | |
| 1996 | 60.4 | 19.5 | 5.7 | 13.4 | 0.9 | 100.0 | 8,332.8 | |
| 1997 | 59.6 | 19.0 | 5.7 | 14.7 | 0.9 | 100.0 | 8,324.3 | |
| 1998 | 59.7 | 19.8 | 6.6 | 13.1 | 0.8 | 100.0 | 8,555.6 | |
| 1999 | 59.5 | 19.7 | 5.6 | 14.3 | 0.9 | 100.0 | 8,692.1 | |
| 2000 | 59.3 | 20.0 | 6.2 | 13.6 | 0.9 | 100.0 | 8,990.3 | |
| 2001 | 59.3 | 19.8 | 6.8 | 13.7 | 0.4 | 100.0 | 9,061.9 | |
| 2002 | 59.3 | 19.9 | 6.5 | 13.9 | 0.4 | 100.0 | 9,244.3 | |
| 2003 | 59.5 | 20.4 | 6.8 | 13.0 | 0.3 | 100.0 | 9,396.5 | |
| |
| (a) Excluding owner managers of incorporated enterprises |
Employees (excluding owner managers of incorporated enterprises) with paid sick and/or holiday leave entitlements represent the largest category, although their share of employment has dropped from 62.0% in August 1992 to 59.5% in August 2003. Most of the change occurred in the period from 1992 to 1997, with the proportion remaining relatively stable from 1997 onwards.
As shown in the graph on the next page, over the same period employees (excluding owner managers of incorporated enterprises) without paid leave entitlements rose as a proportion of total employment, from 16.9% in 1992 to 20.4% in 2003. Most of this increase occurred in the period to 1998.
Types of employment, Proportion of employed - 1992 to 2003
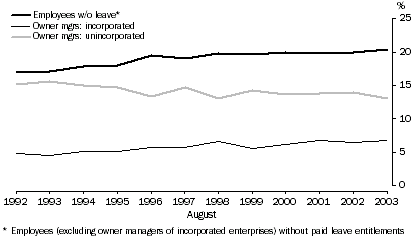
Owner managers remained stable at about 20% of employment, varying between a minimum of 19.1% and a maximum of 20.5% during the period between 1992 and 2003. However, the split between incorporated and unincorporated enterprises has changed. Owner managers of incorporated enterprises increased proportionally from under a quarter (24.3%) of owner managers in 1992, to just over a third (34.1%) by 2003.
Contributing family workers declined as a proportion of employment, from 1.0% of employment in 1992 to 0.3% of employment in 2003.
Note on time series data
When looking at the time series produced as a result of this analysis, the focus should be on longer term changes. Movements from year to year may not be significant due to sampling error. (For further information see paragraphs 14 and 15 of the Explanatory Notes.)
In April 2001, a new LFS questionnaire was introduced. One of the objectives of the new questionnaire was to introduce minor definitional changes to labour force status. These changes had a net effect of a slight reduction in unemployment and persons not in the labour force, and a slight increase in employment. For more information see Information Paper: Implementing the Redesigned Labour Force Survey Questionnaire (cat. no. 6295.0). In addition, changes were made to questions relating to status in employment and hours worked. While these concepts did not change, there is some evidence suggesting that the new questions may have had a small impact on some of the series relating to full-time/part-time status and status in employment.
CHARACTERISTICS OF TYPES OF EMPLOYMENT
Full-time and part-time workers
Although the dominant type of employment is still as an employee with paid leave entitlements working full-time, this has declined from 56% in 1992 to 50% in 2003.
There is a strong relationship between part-time employment and working as an employee without paid leave entitlements. In 2003, 70% of employees without paid leave entitlements worked part-time (down from 75% in 1992).
Between 1992 and 2003, the proportion of owner managers who worked part-time increased from 17% to 20% for owner managers of incorporated enterprises, and from 26% to 30% for owner managers of unincorporated enterprises.
Employed persons, Type of employment by full-time/part-time status - 1992 and 2003 |
| |
| | Proportion of employed
| | | |
| | Full-time | Part-time | Total | Total | Proportion employed part-time | |
| | % | % | % | '000 | % | |
| |
| 1992 | | | | | | |
| Employees with paid leave entitlements(a) | 55.6 | 6.5 | 62.0 | 4,738.3 | 10.4 | |
| Employees without paid leave entitlements(a) | 4.2 | 12.8 | 16.9 | 1,294.3 | 75.3 | |
| Owner managers of incorporated enterprises | 4.0 | 0.8 | 4.9 | 372.2 | 17.4 | |
| Owner managers of unincorporated enterprises | 11.2 | 3.9 | 15.2 | 1,157.0 | 25.8 | |
| Contributing family workers | 0.2 | 0.8 | 1.0 | 74.9 | 78.6 | |
| Total | 75.3 | 24.7 | 100.0 | 7,636.7 | 24.7 | |
| 2003 | | | | | | |
| Employees with paid leave entitlements(a) | 50.2 | 9.3 | 59.5 | 5,593.9 | 15.6 | |
| Employees without paid leave entitlements(a) | 6.1 | 14.3 | 20.4 | 1,912.8 | 70.3 | |
| Owner managers of incorporated enterprises | 5.4 | 1.3 | 6.8 | 634.6 | 19.5 | |
| Owner managers of unincorporated enterprises | 9.1 | 3.9 | 13.0 | 1,224.2 | 30.1 | |
| Contributing family workers | 0.1 | 0.3 | 0.3 | 30.9 | 84.6 | |
| Total | 70.9 | 29.1 | 100.0 | 9,396.5 | 29.1 | |
| |
| (a) Excluding owner managers of incorporated enterprises |
Sex
Similar proportions of men and women worked as employees with paid leave entitlements (60% and 59% respectively). However, women were more likely to do so on a part-time basis (29% of women working as employees with paid leave entitlements in 2003 worked part-time, compared with 5% of men).
A higher proportion of women worked as employees without paid leave entitlements (26% in 2003, compared with 16% of men), reflecting the higher proportion of women working on a part-time basis (47% compared with 15% of men). Men were more likely to work as an owner manager (24% compared with 14% of women).
Employed persons, Type of employment by full-time/part-time status by sex - 2003 |
| |
| | Proportion of employed
| | | |
| | Full-time | Part-time | Total | Total | Proportion employed part-time | |
| | % | % | % | '000 | % | |
| |
| Males | | | | | | |
| Employees with paid leave entitlements(a) | 56.9 | 2.8 | 59.7 | 3,100.2 | 4.7 | |
| Employees without paid leave entitlements(a) | 7.2 | 8.5 | 15.6 | 811.2 | 54.2 | |
| Owner managers of incorporated enterprises | 8.0 | 0.6 | 8.6 | 445.1 | 6.8 | |
| Owner managers of unincorporated enterprises | 13.1 | 2.8 | 15.9 | 825.6 | 17.8 | |
| Contributing family workers | 0.1 | 0.2 | 0.3 | 14.1 | 79.7 | |
| Total | 85.1 | 14.9 | 100.0 | 5,196.2 | 14.9 | |
| Females | | | | | | |
| Employees with paid leave entitlements(a) | 42.0 | 17.3 | 59.4 | 2,493.7 | 29.2 | |
| Employees without paid leave entitlements(a) | 4.7 | 21.5 | 26.2 | 1,101.6 | 82.1 | |
| Owner managers of incorporated enterprises | 2.3 | 2.2 | 4.5 | 189.4 | 49.2 | |
| Owner managers of unincorporated enterprises | 4.2 | 5.3 | 9.5 | 398.7 | 55.7 | |
| Contributing family workers | - | 0.4 | 0.4 | 16.7 | 88.6 | |
| Total | 53.3 | 46.7 | 100.0 | 4,200.2 | 46.7 | |
| |
| - nil or rounded to zero (including null cells) |
| (a) Excluding owner managers of incorporated enterprises |
Most of the increase in the proportion of employed persons who were employees without paid leave entitlements is due to changes for men rather than women. The proportion of employed men who were employees without paid leave entitlements increased over the period 1992 to 2003, from 11% to 16%, while the proportion for women remained stable at close to 26% over the same period.
Age
In August 2003, people in younger and older age groups were more likely to be working as an employee without paid leave entitlements. People aged 15 to 19 years were most likely to be employees without paid leave entitlements (66%), followed by people aged 20 to 24 years (34%), and people aged 65 years and over (22%).
Employees* without paid leave entitlements, Proportion of employed by age and sex - 2003
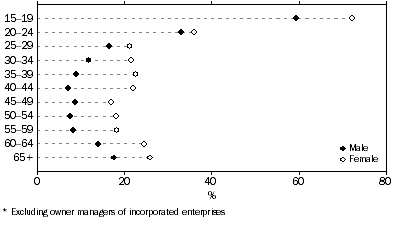
The increase in the proportion of employed persons who were employees without paid leave entitlements has been greatest for people aged 15 to 24 years (from 34% in 1992 to 47% in 2003). This may largely reflect the increase in youth full-time education attendance rates, as full-time students would be expected to be more likely to have part-time jobs without paid leave entitlements. In 2003, 48% of people aged 15 to 24 years were in full-time education, compared to 40% in 1992.
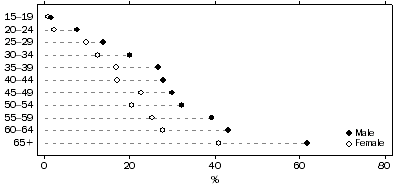
In August 2003, people in older age groups were more likely to be an owner manager. Of employed people aged 65 years and over, 56% were owner managers, compared with only 1% of employed people aged 15 to 19 years.
Owner managers, Proportion of employed by age and sex - 2003
States and territories
South Australia (24%), Queensland (24%) and Tasmania (23%) had the highest proportion of employed persons who were employees without paid leave entitlements in August 2003, with Northern Territory (17%) and Victoria (18%) having the lowest.
Types of employment, Proportion of employed by states and territories - 2003
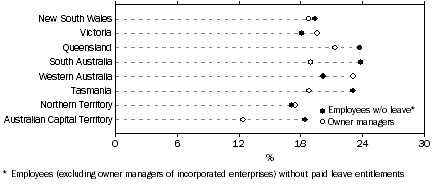
Western Australia had the highest proportion (23%) of owner managers, as a proportion of employed persons, of all states and territories in August 2003, with the Australian Capital Territory being the lowest at 12%.
Industry
Accommodation, cafes and restaurants had the highest proportion of employed persons who were employees without paid leave entitlements (51%), followed by Retail trade (37%) and Cultural and recreational services (32%).
Agriculture, forestry and fishing had the highest proportion of owner managers (58%), followed by Construction (48%).
Government administration and defence and Electricity, gas and water supply had relatively low proportions of both groups, reflecting the predominance of employee jobs with paid leave entitlements in these industries.
Types of employment, Proportion of employed by industry - 2003

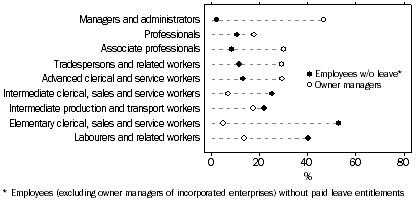
Occupation
Employed persons in lower skilled occupations were more likely to be employees without paid leave entitlements. Elementary clerical, sales and services workers had the highest proportion of employees without paid leave entitlements (53%), followed by Labourers and related workers (40%). The occupations with the lowest proportion of employees without paid leave entitlements were Managers and administrators (2%) and Associate professionals (8%).
Managers and administrators had the highest proportion of owner managers (47%), while the occupations with the lowest proportion of owner managers were Elementary clerical, sales and services workers (5%), and Intermediate clerical, sales and service workers (7%).
Types of employment, Proportion of employed by occupation - 2003
CHANGES IN TYPES OF EMPLOYMENT APPENDIX
APPENDIX 1: EMPLOYMENT TYPE CLASSIFICATIONS
The ABS publishes data related to types of employment through the Status in Employment classification, the Employment Type classification, and estimates of employees with and without paid leave entitlements. The series presented in this analysis follows on from these approaches, using elements of each.
The series 'employees with paid leave entitlements' and 'employees without paid leave entitlements' are similar to the series previously published from the Survey of Employee Earnings and Benefits, but owner managers of incorporated enterprises are now identified separately, and other categories of employed people are included.
The categories presented in this analysis are closely related to the Employment Type classification as used in the Forms of Employment surveys in 1998 and 2001, and the Survey of Employment Arrangements and Superannuation in 2000. This classification combined 'employers' and 'own account workers' into 'owner managers of unincorporated enterprises', and separated owner managers of incorporated enterprises from other employees.
These surveys included a question on whether an employee considered their job to be casual, and this was used to divide employees who were not owner managers of incorporated enterprises into 'employees with paid leave entitlements', 'self identified casuals', and 'employees without paid leave entitlements who did not identify as casual'.
As the question on whether an employee considered their job to be casual was only available in these three surveys, it is not possible to present this data on a time series basis prior to 1998.
Employees without paid leave entitlements
Information on employees with and without paid leave entitlements is published annually in Employee Earnings, Benefits and Trade Union Membership (cat. no. 6310.0).
Prior to August 2000, the ABS published estimates of 'casual' and 'permanent' employees from the Survey of Employee Earnings and Benefits, based on access to paid leave. However, being without paid leave entitlements is not equivalent to being employed on a casual basis and, from August 2000, these terms were removed.
Estimates of employees with and without paid leave entitlements published from the Survey of Employee Earnings and Benefits have included owner managers of incorporated enterprises. Since a lower proportion of owner managers of incorporated enterprises have paid leave entitlements (45% in August 2003) than other employees (75%), there was criticism that their inclusion distorted the proportion of employees with paid leave entitlements.
COMPARISON WITH OTHER DATA
The graph below shows the number of employees without paid leave entitlements series originally published in the Survey of Employee Earnings and Benefits publication Employee Earnings, Benefits and Trade Union Membership (cat. no. 6310.0) compared with the series developed for this analysis. The series is consistently lower, reflecting the exclusion of owner managers of incorporated enterprises.
The gap between the two series has increased in recent years, reflecting the increase in the proportion of owner managers of incorporated enterprises.
Employees without paid leave entitlements - 1992 to 2003
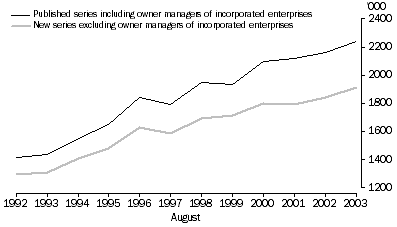
According to the estimates published from the Survey of Employee Earnings and Benefits, employees without paid leave entitlements as a proportion of all employees increased from 22.3% in 1992 to 27.6% in 2003. The series in this article, which excludes owner managers of incorporated enterprises, showed a lower proportion of employees without paid leave entitlements, with the proportion increasing from 21.5% in 1992 to 25.5% in 2003.
The analysis presented in this article is generally as a proportion of all employed, rather than of employees (or, in the latter case, employees excluding owner managers of incorporated enterprises). These proportions are lower again, although still showed an increase from 16.9% in 1992 to 20.4% in 2003.
APPENDIX 2: DATA SOURCES AND METHODOLOGY
Since the monthly LFS does not collect information about paid leave entitlements, and since the Survey of Employee Earnings and Benefits only covers employees and has weights that have not been adjusted for LFS rebenchmarking, for the purposes of this analysis data from both datasets have been used. This section provides more information about each collection, as well as details of the methodology used to produce the series presented in this article.
LABOUR FORCE SURVEY
The LFS is conducted each month on a sample of about 30,000 households, which translates to a sample of about 62,000 people who are usually resident in those households. Demographic data are collected each month, as well as details of labour force activity (e.g. whether working or not, number of hours worked during the week, etc.). In the middle month of each quarter (February, May, August, November) extra information is collected, including industry and occupation. For most months of the year additional questions are added on to the end of the LFS to obtain information on specific topics. These topics are generally referred to as supplementary surveys.
Population benchmarks
LFS estimates of persons employed, unemployed and not in the labour force are calculated in such a way as to add up to independent estimates of the civilian population aged 15 and over (population benchmarks).
The benchmarks are based on Census of Population and Housing data, adjusted for differences in scope, under-enumeration in the Census, and updated monthly for births, deaths, interstate and intrastate migration, and net permanent and long-term overseas migration. Benchmarks are classified by state/territory of usual residence, part of state of usual residence (capital city/balance of state), age and sex. Each cross-classification of these benchmark variables is known as a benchmark cell.
Expansion factors, or weights, are applied to the survey's sampled respondents to derive estimates that relate to the whole population in the scope of the survey each month. Each sample respondent is allocated a weight depending on their benchmark cell and state/territory of enumeration.
LFS estimates for each characteristic of interest are formed by summing the weights of the respondents in the sample with that characteristic. The weighting procedure reduces sampling variability by ensuring that estimates conform to the benchmark distribution of the usually resident civilian population by age, sex and geographic area, while simultaneously compensating and adjusting for any under-enumeration or non-response in the survey.
Every five years, LFS estimates are revised when updated benchmarks become available from the Census of Population and Housing. From February 2004, LFS estimates are compiled using revised population benchmarks based on results from the 2001 census. LFS estimates for the period January 1999 to January 2004 have been revised based on the updated population benchmarks.
The LFS questionnaire
While there are questions included in the LFS questionnaire that can be used to identify owner managers of incorporated enterprises, these questions were not specifically designed for this purpose, and analysis indicates that they do not identify all owner managers of incorporated enterprises. The questions used prior to April 2001 were thought to identify around 90% of owner managers of incorporated enterprises. The count of owner managers of incorporated enterprises has increased since April 2001, and it is thought that around 95% may now be identified, although there has not been any testing to confirm this. A question to be included in the November 2004 Forms of Employment Survey - asking people who say that they work for an employer, whether that is as part of their own business - should be able to verify the proportion of owner managers of incorporated enterprises now being identified.
The Business Register check
Prior to February 2000, the employer or business name and address provided by an LFS respondent was compared with information on the ABS Business Register. Where a matching entry was found, the legal status recorded on the Register was used to override the legal status provided by the respondent. Legal status is required because the owner-manager of an incorporated business is classed as an employee, whereas the owner manager of an unincorporated business is classed as an employer or own account worker. This treatment ensures that LFS data are consistent with Australian National Accounts data.
The ABS Business Register check was conducted in the mid-month of the quarter (February, May, August and November). Where there was no matching Business Register entry (about 50% of cases) or the Business Register check was not done, the business's legal status provided by the respondent was accepted.
The ABS found it costly and difficult to maintain accurate location level information on its Business Register for large, multi-location businesses. On cost-benefit grounds, it was decided to cease recording location level data for such entities in certain industries. As a result, the Business Register check in the LFS ceased, as the rate of matching responses to the Register was expected to drop to levels that would make the coding method no longer viable. From the February 2000 survey onwards, only the respondent’s description of the legal status of their business has been used, and the ABS Business Register check has been discontinued.
For consistency, the analysis in this article does not use the Status in Employment series resulting from the Business Register check for legal status. Instead, the information provided by the respondent has been used, so the estimates of employees and owner managers of unincorporated enterprises will not match those published for periods prior to February 2000.
SURVEY OF EMPLOYEE EARNINGS AND BENEFITS
The Survey of Employee Earnings and Benefits is a supplementary survey conducted in August each year, on a reduced sample of the households selected in the LFS in August each year. The LFS sample is reduced in several ways. One-eighth of the sample each month leaves the survey, and this outgoing group is excluded from the Survey of Employee Earnings and Benefits. Additional exclusions are people living in private dwellings in remote and sparsely settled parts of Australia, institutionalised people, and boarding school pupils. The scope of the Survey of Employee Earnings and Benefits is further limited to employees, hence excluding owner managers of unincorporated enterprises and contributing family workers.
Weights for supplementary survey results are originally derived from the LFS weights, but take into account the reduced sample size. However, these weights are not subsequently revised to account for later revisions to the LFS weights. This means that, after any revision to LFS benchmarks, estimates can be inconsistent between supplementary surveys and the LFS.
Estimates of employees with and without paid leave entitlements produced from the Survey of Employee Earnings and Benefits could result in different estimates of employees with and without paid leave entitlements than if the questions about paid leave entitlements were asked of all employees in the LFS, because of the difference in samples and weighting between the two surveys.
METHODOLOGY
1. Estimates calculated from LFS data
Estimates of the following groups were obtained using rebenchmarked LFS weights.
- employee (not an owner manager of an incorporated enterprise)
- owner manager of an incorporated enterprise
- owner manager of an unincorporated enterprise
- contributing family worker
2. Estimates calculated using both LFS and Survey of Employee Earnings and Benefits data
Estimates of the following groups were obtained using a combined LFS/Survey of Employee Earnings and Benefits weight.
- employee (not an owner manager of an incorporated enterprise) with paid leave entitlements
- employee (not an owner manager of an incorporated enterprise) without paid leave entitlements
The weight was based on the original weights from the Survey of Employee Earnings and Benefits, but benchmarked to the most recently released LFS estimates of employees (excluding owner managers of incorporated enterprises).
The estimates in this article are not comparable with those published in other ABS products.
FOR MORE INFORMATION
For further information, please contact the Assistant Director, Labour Market, on Canberra 02 6252 5758.
Spreadsheets containing the data used in this article are now available to purchase through AusStats via the ABS home page [AusStats - Publications and Data], then [Data Cubes - 6105.0 Australian Labour Market Statistics - Table 2 Types of employment 1992-2003].
For email enquiries, please contact Client Services on client.services@abs.gov.au.
 Print Page
 Print All