|
|
FEATURE ARTICLE: RECENT TAXATION REVENUE TRENDS IN AUSTRALIA
INTRODUCTION
The purpose of this article is to present experimental measures of taxation revenue which take account of the level of government at which the revenue is used, as well as an experimental measure of the total revenue available to governments after direct and indirect transfers to households. The article is presented in two main parts. The first part presents the methodology used to derive these experimental measures. The second part presents the results, and provides some background on how the introduction of The New Taxation System affected the sources of taxation revenue in Australia. The analysis commences in 1998-99, as this was the year accrual reporting was introduced into ABS government finance statistics.
The ABS is interested in feedback on the usefulness of this presentation. Comments can be provided to Jason Annabel, Public Finance Section on (02) 6252 5227 or or Heather Olley on (02) 6252 6718 or email <client.services@abs.gov.au>.
METHODOLOGY
The ABS releases Taxation Revenue statistics on an annual basis. The conceptual basis for these statistics is set out in the ABS publication Australian System of Government Finance Statistics: Concepts, Sources and Methods (CSM) (cat. no. 5514.0). The ABS CSM is consistent with the International Monetary Fund’s Government Finance Statistics Manual 2001 (IMF GFSM 2001). This article takes as its starting point the compilation of taxation revenue as set out in both these manuals. Users should note however that the experimental measures developed in this article are not themselves part of the Government Finance Statistics (GFS) framework.
The taxation revenue statistics presented by the ABS as part of its GFS framework reflect taxation revenue collected by each level of government. What is not evident from those statistics are the flows that occur between the levels of government in Australia, and the subsequent revenue available for ‘own use’ at each of these levels after the transfers by way of current grants have occurred. To aid in the understanding of these flows, this article presents three new experimental analytical measures:
- taxation revenue for own use;
- total revenue for own use; and
- total revenue for own use less transfers to households.
The relationship between these measures and the existing GFS taxation revenue estimates is set out in the framework and discussion below. The framework also indicates the relevant tables later in the article where data on that particular analytical measure is located.
Framework for Analytical Measures of Taxation and Total Revenue
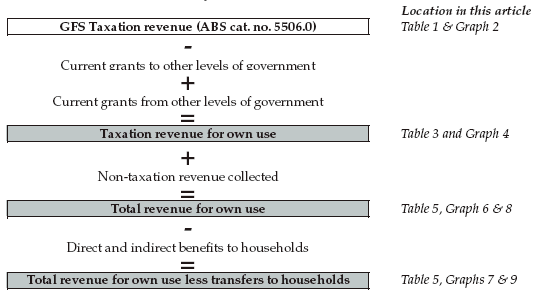
The measures shown above can be derived for each level of government (ie, Commonwealth, state and local) and, for the state government level, by jurisdiction. The measures can also be expressed as a proportion of Gross Domestic Product (GDP) at nominal prices to enable changes over time to be assessed in the context of the overall level of economic activity. At the state government level, the measures could be expressed as a proportion of Gross State Product (GSP) to enable jurisdictions to be compared on a basis that takes account of the relative size of state economies.
Taxation revenue for own use
Taxation revenue available to each level of government for that level’s own purposes can be identified as taxation revenue for own use (the first analytical measure presented in the framework above). Taxation revenue for ‘own use’ for a particular level of government is the taxation revenue collected by that level of government adjusted for the impact of current grants to and from other levels of government.
Total revenue for own use
Analysis of taxation revenue for own use can also be usefully undertaken in the context of total revenue for own use (the second analytical measure presented in the framework above). For the purposes of this analysis, total revenue for own use is defined as taxation revenue for own use, plus all other non-taxation sources of revenue. Non-taxation revenue includes revenue from sales of goods and services, interest income, other property income (such as dividends, income tax equivalents, land rents and royalties), fines, capital revenue, and all current revenue other than grants. Taxation revenue for own use can be analysed in the context of trends in total revenue available to each level of government over time, for example to determine whether taxation revenue for own use is accounting for a higher proportion of government revenue over time.
Current grants are excluded from the item ‘non-taxation revenue collected’ as these flows have already been taken into account in deriving the ‘taxation revenue for own use’ measure.
Total revenue for own use less transfers to households
An important role of government is the redistribution of income, by way of direct and indirect ‘benefits’, which are transferred to individual households. These transfers can be deducted from total revenue for own use to derive a measure of total revenue for own use less transfers to households (the third analytical measure presented in the framework above). This measure indicates the revenue available to governments for collective consumption (such as defence, and certain health and education expenditures) and for other policy and financial purposes. The resulting estimates provide a government sector view along similar lines to the ‘fiscal incidence’ studies the ABS has previously undertaken on the effects of government benefits and taxation on the distribution of income among households (refer to Government Benefits, Taxes and Household Income 1998-99 (cat. no. 6357.0)).
Direct benefits are regular cash payments made to households by government without any requirement to provide goods and services in return (for example, welfare payments). Indirect
benefits are non-cash benefits and services provided by government to individual households (for example, concessions for transport and utilities, as well as natural disaster relief).
RESULTS
Taxation revenue
Table 1 provides the ABS GFS Taxation Revenue series for the period 1998-99, when accrual accounting was introduced in GFS, to 2003-04, which is the most recent year for which statistics are available.
1. TAXATION REVENUE, GENERAL GOVERNMENT: ALL LEVELS OF GOVERNMENT (a)
|
 | | 1998-99 | | 1999-2000 | | 2000-01 |
| |
| |
| |
|
| Type of Tax | Commonwealth $m | State and Local $m | All Australian governments $m (b) | | Commonwealth $m | State and Local $m | All Australian governments $m (b) | | Commonwealth $m | State and Local $m | All Australian governments $m (b) |
|
| Income tax | | | | | | | | | | | |
| Levied on individuals | 77,518 | - | 77,518 | | 83,788 | - | 83,788 | | 77,425 | - | 77,425 |
| Levied on enterprises | 25,472 | - | 25,472 | | 29,516 | - | 29,516 | | 42,221 | - | 42,221 |
| Levied on non-residents (c) | 1,070 | - | 1,070 | | 1,215 | - | 1,215 | | 1,215 | - | 1,215 |
| Total | 104,060 | - | 104,060 | | 114,520 | - | 114,520 | | 120,861 | - | 120,861 |
| | | | | | | | | | | | |
| Employers' payroll taxes | | | | | | | | | | | |
| General (payroll tax) | - | 8,433 | 8,186 | | - | 8,935 | 8,684 | | - | 9,484 | 9,215 |
| Other employers' labour force taxes | 3,376 | - | 3,259 | | 3,521 | - | 3,423 | | 3,577 | - | 3,487 |
| Total | 3,376 | 8,433 | 11,444 | | 3,521 | 8,935 | 12,107 | | 3,577 | 9,484 | 12,702 |
| | | | | | | | | | | | |
| Taxes on property | | | | | | | | | | | |
| Immovable property | - | 8,051 | 8,047 | | - | 8,441 | 8,438 | | - | 9,061 | 9,061 |
| Financial and capital transactions | 5 | 8,387 | 8,391 | | 10 | 9,657 | 9,667 | | 12 | 9,736 | 9,748 |
| Total | 5 | 16,437 | 16,438 | | 10 | 18,099 | 18,105 | | 12 | 18,797 | 18,809 |
| | | | | | | | | | | | |
| Taxes on provision of goods and services | | | | | | | | | | | |
| General taxes (sales tax) | 15,083 | - | 15,083 | | 15,644 | - | 15,644 | | 1,976 | - | 1,976 |
| Goods and Services Tax (GST) | - | - | - | | - | - | - | | 23,854 | - | 23,854 |
| Excise and levies | 14,521 | 17 | 14,538 | | 14,922 | 18 | 14,940 | | 19,751 | 17 | 19,768 |
| International trade | 3,643 | - | 3,643 | | 3,799 | - | 3,799 | | 4,606 | - | 4,606 |
| Gambling | - | 4,146 | 4,146 | | - | 4,420 | 4,420 | | - | 3,568 | 3,568 |
| Insurance | - | 2,009 | 2,009 | | - | 2,139 | 2,139 | | - | 2,403 | 2,403 |
| Total | 33,246 | 6,172 | 39,419 | | 34,365 | 6,576 | 40,941 | | 50,186 | 5,987 | 56,173 |
| | | | | | | | | | | | |
| Taxes on use of goods and performance of activities | | | | | | | | | | | |
| Motor vehicle taxes | 20 | 3,901 | 3,921 | | 21 | 3,891 | 3,911 | | - | 4,033 | 4,033 |
| Franchise taxes | - | 5,688 | 5,688 | | - | 5,819 | 5,819 | | - | 325 | 325 |
| Other | 392 | 510 | 902 | | 432 | 564 | 997 | | 670 | 418 | 1,088 |
| Total | 412 | 10,099 | 10,511 | | 453 | 10,274 | 10,727 | | 670 | 4,776 | 5,445 |
| | | | | | | | | | | | |
| Total | 141,100 | 41,142 | 181,873 | | 152,869 | 43,883 | 196,400 | | 175,306 | 39,044 | 213,990 |
| GDP (d) | | | 607863 | | | | 645153 | | | | 689,340 |
| Total taxation as a percentage of GDP (%) | 23.2 | 6.8 | 29.9 | | 23.7 | 6.8 | 30.4 | | 25.4 | 5.7 | 31.0 |
|
| (a) As published in Taxation Revenue, Australia, 2003-04 (cat no 5506.0). |
| (b) The sum of individual levels of government may not agree with totals for all levels of government, due to inter-governmental taxation. |
| (c) From 2001-02, withholding taxes on non-residents are no longer separately identifiable under the PAYG system. The values shown for 2001-02 and subsequent years are estimates based on methodologies developed by the Balance of Payments area within the ABS. |
| (d) As published in Australian System of National Accounts, 2004-05 (cat.no. 5204.0), Table 5. |
|
1. TAXATION REVENUE, GENERAL GOVERNMENT: ALL LEVELS OF GOVERNMENT (a) - continued
|
| | 2001-02 | | 2002-03 | | 2003-04 |
| |
| |
| |
|
| Type of Tax | Commonwealth $m | State and Local $m | All Australian governments $m (b) | | Commonwealth $m | State and Local $m | All Australian governments $m (b) | | Commonwealth $m | State and Local $m | All Australian governments $m (b) |
|
| Income tax | | | | | | | | | | | |
| Levied on individuals | 86,112 | - | 86,112 | | 91,484 | - | 91,484 | | 98,979 | - | 98,979 |
| Levied on enterprises | 31,782 | - | 31,782 | | 38,696 | - | 38,696 | | 41,990 | - | 41,990 |
| Levied on non-residents (c) | 1,138 | - | 1,138 | | 1,098 | - | 1,098 | | 1,097 | - | 1,097 |
| Total | 119,032 | - | 119,032 | | 131,278 | - | 131,278 | | 142,067 | - | 142,067 |
| | | | | | | | | | | | |
| Employers' payroll taxes | | | | | | | | | | | |
| General (payroll tax) | - | 9,654 | 9,367 | | - | 10,137 | 9,828 | | - | 10,820 | 10,501 |
| Other employers' labour force taxes | 3,831 | - | 3,730 | | 3,085 | - | 2,968 | | 3,658 | - | 3,526 |
| Total | 3,831 | 9,654 | 13,097 | | 3,085 | 10,137 | 12,796 | | 3,658 | 10,820 | 14,027 |
| | | | | | | | | | | | |
| Taxes on property | | | | | | | | | | | |
| Immovable property | - | 9,511 | 9,509 | | - | 10,385 | 10,381 | | - | 11,459 | 11,455 |
| Financial and capital transactions | 12 | 9,672 | 9,684 | | 13 | 10,989 | 11,001 | | 13 | 12,879 | 12,891 |
| Total | 12 | 19,184 | 19,192 | | 13 | 21,374 | 21,383 | | 13 | 24,338 | 24,346 |
| | | | | | | | | | | | |
| Taxes on provision of goods and services | | | | | | | | | | | |
| General taxes (sales tax) | 791 | - | 791 | | 896 | - | 896 | | 1,002 | - | 1,002 |
| Goods and Services Tax (GST) | 27,389 | - | 27,389 | | 31,257 | - | 31,257 | | 34,121 | - | 34,121 |
| Excise and levies | 20,489 | 5 | 20,494 | | 21,645 | 3 | 21,648 | | 21,903 | 4 | 21,907 |
| International trade | 5,214 | - | 5,214 | | 5,573 | - | 5,573 | | 5,622 | - | 5,622 |
| Gambling | - | 3,707 | 3,707 | | - | 3,843 | 3,843 | | - | 4,040 | 4,040 |
| Insurance | - | 2,836 | 2,836 | | - | 3,132 | 3,132 | | - | 3,231 | 3,231 |
| Total | 53,883 | 6,548 | 60,431 | | 59,371 | 6,977 | 66,348 | | 62,646 | 7,275 | 69,922 |
| | | | | | | | | | | | |
| Taxes on use of goods and performance of activities | | | | | | | | | | | |
| Motor vehicle taxes | - | 4,291 | 4,291 | | - | 4,691 | 4,690 | | - | 5,126 | 5,126 |
| Franchise taxes | - | 13 | 13 | | - | 10 | 10 | | - | 12 | 12 |
| Other | 722 | 381 | 1,103 | | 757 | 401 | 1,158 | | 811 | 456 | 1,267 |
| Total | 722 | 4,685 | 5,407 | | 757 | 5,102 | 5,859 | | 811 | 5,594 | 6,405 |
| | | | | | | | | | | | |
| Total | 177,481 | 40,071 | 217,160 | | 194,504 | 43,590 | 237,664 | | 209,195 | 48,028 | 256,767 |
| GDP (d) | | | 735,783 | | | | 782,798 | | | | 838,251 |
| Total taxation as a percentage of GDP (%) | 24.1 | 5.4 | 29.5 | | 24.8 | 5.6 | 30.4 | | 25.0 | 5.7 | 30.6 |
|
| (a) As published in Taxation Revenue, Australia, 2003-04 (cat no 5506.0). |
| (b) The sum of individual levels of government may not agree with totals for all levels of government, due to inter-governmental taxation. |
| (c) From 2001-02, withholding taxes on non-residents are no longer separately identifiable under the PAYG system. The values shown for 2001-02 and subsequent years are estimates based on methodologies developed by the Balance of Payments area within the ABS. |
| (d) As published in Australian System of National Accounts, 2004-05 (cat.no. 5204.0), Table 5. |
|
Impact of The New Taxation System
The New Taxation System was introduced on 1 July 2000, which included the introduction of the Goods and Services Tax (GST). The main aspects of TNTS affecting the taxation revenue series are as follows.
- As part of the Intergovernmental Agreement (IGA) on the Reform of Commonwealth-State Financial Relations of June 1999, signed by the Prime Minister, all Premiers and Chief Ministers, the Commonwealth Government enacted legislation to impose the GST from 1 July 2000 and to ensure that all of the GST revenue be provided to the states. The states fully compensate the Commonwealth for the agreed costs of administering the GST.
- Under the IGA, the Commonwealth permanently ceased the Commonwealth wholesale sales tax and the so-called safety net taxation arrangements from 1 July 2000. State governments also permanently ceased bed taxes from 1 July 2000, and financial institutions duties and stamp duties on quoted marketable securities on 1 July 2001. State gambling taxation was adjusted to take account of the impact of the GST on gambling operators. Debits tax ceased to be levied in any state from 1 July 2005. Commonwealth income tax arrangements were outside the scope of TNTS and, as such, the Commonwealth continues to retain income tax for its own purposes.
- Associated with the introduction of the GST were reductions in income tax rates for individuals, and changed arrangements for the payment of income taxes for individuals and companies with the introduction of the Pay As You Go (PAYG) system. Changes to company income tax rates were also introduced as a result of the Review of Business Tax.
- Under the IGA, the Commonwealth guaranteed that, in each of the transitional years following the introduction of TNTS, each state’s budgetary position would be no worse off than had tax reform not been implemented. This transitional assistance was known as Budget Balancing Assistance (BBA). As at 2003-04 only New South Wales was still in need of BBA. The Commonwealth’s Final Budget Outcome document for 2004-05 indicates that no state was receiving BBA in that financial year. This transitional assistance from the Commonwealth Government should be taken into account when analysing the time series.
While, for the most part, it is not possible to specifically identify the impact of TNTS on changes in taxation revenue, in many cases it is clear that TNTS had an impact on revenue streams. The main impacts include:
- A 7.6% fall in income taxes on individuals in 2000-01. The fall in personal income tax rates associated with TNTS was partially offset by growth in underlying income. Income tax collections from individuals increased by 11.2% in 2001-02, 6.2% in 2002-03 and 8.2% in 2003-04, due primarily to increases in PAYG withholding collections as well as increases in revenue from the Medicare Levy, both as a result of growth in wages and increased employment. The growth rates for these years are distorted by other elements of TNTS including the impact of moving provisional taxpayers into PAYG.
- Despite a fall in the company tax rate from 36% to 34% on 1 July 2000, tax payments by enterprises increased by 43% in 2000-01, due mainly to strong growth in company profits and the overlap of tax liabilities arising from the introduction of PAYG. Tax obligations for 1999-2000 (under the previous taxation arrangements) in addition to PAYG instalments for 2000-01 (under TNTS) both occurred during 2000-01 resulting in a one-off boost to taxation revenue that was unwound the following year. The 24.7% decrease in taxes on enterprises in 2001-02 also reflects a reduction in the company tax rate from 34% to 30% on 1 July 2001.
- An 87.4% decrease in general sales tax in 2000-01 reflecting the abolition of Wholesale Sales Taxes from 1 July 2000.
- The collection of $23,854m in GST revenue in 2000-01. In ABS statistics (and consistent with the IMF GFSM 2001), GST is classified as a Commonwealth tax, as the Commonwealth has the ultimate role in establishing the mechanism of GST collection, the rate of tax, and the distribution of GST revenue. The disbursement of these amounts to state governments as grants is examined in more detail later in this article. GST revenue in 2001-02 was $27,389m, up 14.8% from 2000-01, $31,257m in 2002-03, up 14.1%, and $34,121m in 2003-04, up 9.2%. It should be noted that, in 2000-01, GST collections were on the basis of only 11 statement months and three statement quarters, compared with the full year period of collection in 2001-02.
- An increase of 32.3% in revenue from excises and levies in 2000-01. The main reason for this growth was rolling franchise tax revenue (which includes gas, petroleum product, tobacco and liquor taxes) into excise revenue. Revenue from excises and levies increased a further 3.7% in 2001-02, an additional 5.6% in 2002-03 and 1.2% in 2003-04.
- A fall of 19.3% in gambling taxes (which are levied by states) in 2000-01, partly due to adjustments to take account of the impact of the GST on gambling operators. Taxation on gambling increased by 3.9% in 2001-02, 3.7% in 2002-03 and 5.1% in 2003-04.
- The increase of 13.9% for taxes on property levied by state and local governments in 2003-04 was due to growth in the areas of commercial and residential real estate prices and an increase in the number of real estate transactions.
While the GST raised $23,854m of new taxation revenue in 2000-01, overall total taxation revenue collected by all Australian governments only increased by $17,590m, reflecting the changing mix of revenue sources as a result of TNTS arrangements and economic growth underpinning the tax base.
Taxation revenue - Commonwealth government
Taking account of the changes in the components of the taxation base set out above, taxation revenue directly collected by the Commonwealth increased by 14.7% in 2000-01. subsequently, this rose by 1.2% in 2001-02, 9.6% in 2002-03 and 7.6% in 2003-04. This mainly reflects the growth in GST, as well as increases in business tax revenue, due to strong growth in company profits and the one-off impact of the ‘bringing forward’ of company tax in 2000-01 associated with the introduction of the PAYG system.
Taxation revenue - State and Local governments
Under TNTS, in 2000-01 state governments relinquished bed taxes and reduced gambling taxation rates. Also in 2000-01 there was a significant reduction in franchise taxes attributed to the states, with franchise tax revenue rolled into excise taxes as collected by the Commonwealth. Consequently, in 2000-01 there was a fall of $4,839m (11.0%) in directly collected taxation revenue.
Taxation revenue for own use
Taxation revenue for own use is shown in Table 3 for each level of government.
3. TAXATION REVENUE FOR OWN USE (a)
|
| | 1998-99 | 1999-2000 | 2000-01 | 2001-02 | 2002-03 | 2003-04 |
| | $m | $m | $m | $m | $m | $m |
|
| Commonwealth government |
| 1. Taxation revenue (b) (c) | 141,100 | 152,869 | 175,306 | 177,481 | 194,504 | 209,195 |
| 2. Current grants to state government (d) | 31,408 | 33,000 | 44,268 | 49,283 | 51,170 | 54,109 |
| 3. Current grants to local government | 226 | 205 | 102 | 490 | 274 | 351 |
| 4. Current grants to multi-jurisdictional sector (e) | 4,237 | 3,990 | 4,118 | 4,327 | 4,381 | 4,893 |
| Taxation revenue for own use = 1-2-3-4 (f) | 105,229 | 115,674 | 126,818 | 123,381 | 138,679 | 149,842 |
| As % of GDP | 17.3 | 17.9 | 18.4 | 16.8 | 17.7 | 17.9 |
| As % of Total Taxation revenue | 57.9 | 58.9 | 59.3 | 56.8 | 58.4 | 58.4 |
| | | | | | | |
| State government | | | | | | |
| 1. Taxation revenue (b) | 35,435 | 37,893 | 32,677 | 33,342 | 36,406 | 40,394 |
| 2. Current grants from Commonwealth government (including GST receipts) | 31,408 | 33,000 | 44,268 | 49,283 | 51,170 | 54,109 |
| 3. Current grants to local government | 1,740 | 1,922 | 2,056 | 1,981 | 1,810 | 1,996 |
| 4. Current grants to multi-jurisdictional sector (e) | 115 | 121 | 142 | 219 | 214 | 240 |
| Taxation revenue for own use =1+2-3-4 (f) | 64,988 | 68,850 | 74,747 | 80,425 | 85,552 | 92,267 |
| As % of GDP | 10.7 | 10.7 | 10.8 | 10.9 | 10.9 | 11 |
| As % of Total Taxation revenue | 35.7 | 35.1 | 34.9 | 37 | 36 | 35.9 |
| | | | | | | |
| Local government | | | | | | |
| 1. Taxation revenue (b) | 5,725 | 6,017 | 6,394 | 6,758 | 7,215 | 7,663 |
| 2. Current grants from Commonwealth government | 226 | 205 | 102 | 490 | 274 | 351 |
| 3. Current grants from state government | 1,740 | 1,922 | 2,056 | 1,981 | 1,810 | 1,996 |
| Taxation revenue for own use =1+2+3 (f) | 7,691 | 8,144 | 8,552 | 9,229 | 9,299 | 10,010 |
| As % of GDP | 1.3 | 1.3 | 1.2 | 1.3 | 1.2 | 1.2 |
| As % of Total Taxation revenue | 4.2 | 4.1 | 4 | 4.2 | 3.9 | 3.9 |
| | | | | | | |
| GDP (g) | 607,863 | 645,153 | 689,340 | 735,783 | 782,798 | 838,251 |
|
| (a) Experimental analytical measure - refer to methodology section of this article. |
| (b) As published in Taxation Revenue, Australia, 2003-04 (cat. no. 5506.0). |
| (c) A break in series occurred in 2001-02 in relation to the treatment of the Family Tax Benefit (FTB) scheme. Prior to 2001-02, disbursements related to the FTB were treated as tax offsets, and as such the FTB was not reflected in estimates of Commonwealth taxation revenue. In 2001-02, the treatment was changed, such that FTB refunds to recipients claiming a higher tax free threshold, or as a reductions in remitted tax through the PAYG withholding and instalment systems, are now recorded as expenses. |
| (d) Part of the Commonwealth grants paid to states are onpassed to local government. |
| (e) The multi-jurisdictional sector contains units where jurisdiction is shared between two or more governments, or classification of a unit to a jurisdiction is otherwise unclear. The main type of units currently falling into this category are the public universities. |
| (f) The sum of taxation revenue does not equal the sum of taxation revenue for own use owing to grants paid to the multi-jurisdictional sector. |
| (g) As published in Australian System of National Accounts, 2004-05 (cat. no. 5204.0), Table 5. |
|
Taxation revenue for own use - Commonwealth government
Taking into account taxation revenue distributed by the Commonwealth government to both the state and local levels of government by way of current grants, the level of taxation revenue available for own use by the Commonwealth in 2001-02 was $123,381m. This represented a 2.7% decrease in available taxation revenue for own use from the previous year (compared with the 1.2% increase in directly collected revenue). In 2002-03, taxation revenue for own use was $138,679m, up 12.4% on the previous year. In 2003-04, taxation for own use was $149,842m, up 8.0% on the previous year.
Taxation revenue retained by the Commonwealth for own use in 1998-99 was 57.9% of total Australian taxation revenue. This proportion increased to 58.9% in 1999-2000, and increased further to 59.3% in 2000-01. It decreased in 2001-02 to 56.8% of total Australian taxation revenue. In 2002-03 the Commonwealth retained 58.4% of total Australian taxation revenue for its own use, remaining constant at that level in 2003-04.
Taxation revenue for own use - State governments
Under the terms of the IGA, all GST receipts are provided to the states. However, as there were some offsets, this did not result in an increase in the level of grants to the states by the amount of GST receipts. In 2000-01 current grants from the Commonwealth to states (including GST-related disbursements) rose by a net $11,268m compared with GST receipts of $23,854m. The difference between the GST revenue collected in 2000-01 ($23,854m) and the increase in total grants to the states between 1999-2000 and 2000-01 ($11,268m) reflects the fact that the GST was not wholly additional revenue granted to the states from the Commonwealth. In part, it replaced the Financial Assistance Grants and Revenue Replacement Payments previously made to the states as well as the states’ own
revenue forgone by the removal of certain state taxes. Likewise, Commonwealth government revenue did not increase by the entire amount of the GST, as the GST also replaced Commonwealth wholesale sales tax.
The $11,268m growth in current grants provided from the Commonwealth to the states in 2000-01 more than offset the fall in state government’s own directly collected taxation revenue, following the introduction of The New Tax System. Taking into account these grants received, and grants provided to local government, there was an overall increase of $5,897m in 2000-01 in taxation revenue available for own use by state governments. This was an 8.6% increase on the previous year (compared with a 13.8% fall in directly collected taxation revenue).
Since 2001-02, taxation revenue directly collected by the states has continued its upward trend together with Commonwealth current grants. Accordingly taxation revenue available for own use by state governments has increased by 7.6%, 6.4% and 7.8% respectively over the past three years.
Taxation revenue for own use as a proportion of GDP
Graph 4 shows the taxation revenue for own use for each level of government as a proportion of GDP. As a proportion of GDP, for taxation revenue retained by the Commonwealth for its own use, there were no clear trends. The ratio was highest in 2000-01 at 18.4%, and lowest in 2001-02 at 16.8%. As a proportion of GDP, the equivalent state government measures rose slightly from 10.7% in 1998-99 to 11.0% in 2003-04.
Total revenue for own use
The second analytical measure presented in this article is total revenue for own use. This measure is calculated and presented in Table 5.
Table 5 indicates that for the Commonwealth government, total revenue for own use in 2003-04 was up 7.8% on the previous year, compared with taxation revenue for own use up 8.0% on the previous year. Corresponding figures for state governments were 8.9% and 7.8%, and for local governments 6.8% and 7.6%.
5. TOTAL REVENUE FOR OWN USE, INCLUDING THE IMPACT OF TRANSFERS TO HOUSEHOLDS (a)
|
| | 1998-99 | 1999-2000 | 2000-01 | 2001-02 | 2002-03 | 2003-04 |
| | $m | $m | $m | $m | $m | $m |
|
| Commonwealth | | | | | | |
| 1. Taxation revenue (b) | 141,100 | 152,869 | 175,306 | 177,481 | 194,504 | 209,195 |
| 2. Taxation revenue for own use (c) | 105,229 | 115,674 | 126,818 | 123,381 | 138,679 | 149,842 |
| 3. Non-taxation revenue collected, excluding current grants (d) | 12,163 | 13,889 | 10,196 | 12,446 | 11,876 | 12,409 |
| 4. Total revenue for own use = 2+3 | 117,392 | 129,563 | 137,014 | 135,827 | 150,555 | 162,251 |
| 5. Direct benefits to households (e) | 47,814 | 51,904 | 58,940 | 61,580 | 63,464 | 71,390 |
| 6. Indirect benefits to households (f) | 14,350 | 15,717 | 15,997 | 17,060 | 17,765 | 19,590 |
| 7. Total revenue for own use less transfers to households = 4-5-6 | 55,228 | 61,942 | 62,077 | 57,187 | 69,326 | 71,271 |
| As % of GDP | 9.1 | 9.6 | 9 | 7.8 | 8.9 | 8.5 |
| | | | | | | |
| State | | | | | | |
| 1. Taxation revenue (b) | 35,435 | 37,893 | 32,677 | 33,342 | 36,406 | 40,394 |
| 2. Taxation revenue for own use (c) | 64,988 | 68,850 | 74,747 | 80,425 | 85,552 | 92,267 |
| 3. Non-taxation revenue collected, excluding current grants (d) | 25,002 | 24,335 | 24,321 | 24,204 | 26,275 | 29,465 |
| 4. Total revenue for own use =2+3 | 89,990 | 93,185 | 99,068 | 104,629 | 111,827 | 121,732 |
| 5. Direct benefits to households (e) | 590 | 567 | 721 | 826 | 822 | 993 |
| 6. Indirect benefits to households (f) | 1,750 | 1,764 | 1,907 | 1,868 | 1,960 | 1,859 |
| 7. Total revenue for own use less transfers to households = 4-5-6 | 87,650 | 90,854 | 96,440 | 101,935 | 109,045 | 118,880 |
| As % of GDP | 14.4 | 14.1 | 14 | 13.9 | 13.9 | 14.2 |
| | | | | | | |
| Local | | | | | | |
| 1. Taxation revenue (b) | 5,725 | 6,017 | 6,394 | 6,758 | 7,215 | 7,663 |
| 2. Taxation revenue for own use (c) | 7,691 | 8,144 | 8,552 | 9,229 | 9,299 | 10,010 |
| 3. Non-taxation revenue collected, excluding current grants (d) | 7,193 | 8,164 | 8,530 | 8,883 | 9,695 | 10,273 |
| 4. Total revenue for own use =2+3 | 14,884 | 16,308 | 17,082 | 18,112 | 18,994 | 20,283 |
| 5. Direct and indirect benefits to households (g) | n/a | n/a | n/a | n/a | n/a | n/a |
| 6. Total revenue for own use less transfers to households = 4-5 | 14,884 | 16,308 | 17,082 | 18,112 | 18,994 | 20,283 |
| As % of GDP | 2.4 | 2.5 | 2.5 | 2.5 | 2.4 | 2.4 |
|
| (a) Experimental analytical measure. Refer to methodology section of this article. |
| (b) As published in Taxation Revenue, Australia, 2003-04 (cat. no. 5506.0). |
| (c) As derived in Table 3 above. |
| (d)Non-taxation revenue includes revenue from sales of goods and services, interest income, other property income (such as dividends, income tax equivalents, land rents and royalties), fines, capital revenue, and all current revenue other than grants. |
| (e) Direct benefits to households are monetary transfers. |
| (f) Indirect benefits to households are transfers ‘in kind’ via goods and services. |
| (g) Local government does not make transfers of this kind to households. |
|
Total revenue for own use less transfers to households
Total revenue for own use less transfers to households, which is the third analytical measure presented in this article, is also calculated and presented in Table 5.
When direct and indirect transfers to households are taken into account, states, as a whole, have more total revenue available for their own use than does the Commonwealth. This is argely because of the income redistributive role performed by the Commonwealth via the welfare payment mechanism. In 2001-02, 57.9% of the Commonwealth’s total revenue for own use was transferred to households either directly or indirectly. This figure was 54.0% in 2002-03 and 56.1% in 2003-04.
After adjusting for transfers to households, and comparing to GDP, there was no clear trend in total revenue at the Commonwealth or state levels. At the Comonwealth level, the ratio varied from 7.8% in 2001-02, and 9.6% in 1999-2000. At the state level, the ratios varied from 13.9% in 2001-02 to 14.4% in 1998--99.
Graphs 6 and 7 illustrate the relationship between the total revenue series, and the adjusted series which takes account of transfers to households. These graphs show that after transfers to households are taken into account, state governments collectively have more revenue available for own use than the Commonwealth government.
Comparing series as a proportion of GDP - total revenue for own use, and total revenue for own use less transfers to households
Graph 8 shows total revenue available for own use at each level of government expressed as a percentage of GDP.
Graph 9 reflects total revenue available for own use as a percentage of GDP once transfers to households have been taken into account. Recent increases in transfers to households by the Commonwealth and the impact of this on taxation revenue for own use as a percentage of GDP at that level of government is revealed by a comparison of these two graphs. Commonwealth total revenue available for own use, once adjusted for transfers to households, was 8.5% of GDP in 2003-04, down from 8.9% in 2002-03, whereas for the states it was 14.2% of GDP, up from 13.9% in 2002-03.
FURTHER INFORMATION
Further information on this article may be obtained by contacting Jason Annabel, Public Finance Section on (02) 6252 5227 or email <client.services@abs.gov.au>.
REFERENCES
More information on Taxation Revenue statistics and Government Finance Statistics published by the ABS are available in the following releases:
Government Finance Statistics, Australia (cat. no. 5512.0)
Taxation Revenue, Australia (cat. no. 5506.0)
Australian System of Government Finance Statistics: Concepts, Sources and Methods (cat. no. 5514.0)
Information Paper: Accruals-based Government Finance Statistics (cat. no. 5517.0)
International statistical standards for GFS are set out in the International Monetary Fund’s Government Finance Statistics Manual 2001 (GFSM 2001)
|
 Print Page