Measures of Western Australia's progress
INTRODUCTION
Is the quality of life in Western Australia getting better? Is the standard of living improving? These are questions that have significance for many Western Australians. Although Gross State Product is regarded as an important measure of progress, many analysts believe that it should be assessed in conjunction with other measures of progress.
This article brings together a wide variety of statistics, allowing people to make a more informed judgement on whether the quality of life and standard of living in Western Australia are improving. It looks at 14 major areas of progress or headline dimensions, within four broad categories: Individuals; The economy and economic resources; The environment; and Living together. Most of the indicators chosen also feature in Measures of Australia's Progress (cat. no. 1370.0) which provides more detail on the dimensions and indicators used in this analysis and the issues relevant to them.
INDIVIDUALS
HEALTH
People hope to have a long life without pain, illness or disability. Good health also brings social and economic benefits to both individuals and their families, as well as the wider community. One of the most widely used indicators of population health is life expectancy at birth. Although this focuses on how long people live rather than their quality of life, it is still a useful summary of the health of the population.
Life expectancy at birth is a measure of how long someone born in a particular year might expect to live if mortality patterns for that year remained unchanged over their lifetime. In Western Australia over the 10 years to 2004, life expectancy rose for both males and females. A boy born in 2004 could expect to live to be 79, while a girl could expect to reach 83 - an increase of 3 years for males and 2 years for females from 1994. This increasing life expectancy can largely be attributed to the promotion of healthier lifestyles, continued improvements in living standards, and ongoing medical advances. As can be seen in the graph below, the life expectancy for Western Australians has been slightly higher than the national average for both males and females in each year since 1994 (with the exception of equal male life expectancy in 1997).
LIFE EXPECTANCY AT BIRTH
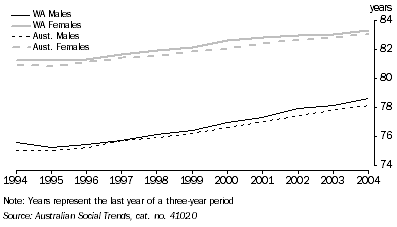
Although life expectancy at birth is greater for girls than boys, over the last 10 years the rate of increase has been faster for boys. A similar pattern has occurred in the survival rates to 75 for males and females in Western Australia. Since 1994, the proportion of males surviving to 75 has risen by 10 percentage points (up from 61% in 1994 to 71% in 2004). This was twice the increase of females surviving to 75 (up from 77% to 82%). Overall, the proportion of males and females surviving to 75 in Western Australia has exceeded the national average in each of the last 10 years.
While Western Australians are living longer than ever before, the length of life for some population groups is less than for others. This is particularly the case for Aboriginal and Torres Strait Islander peoples. In 2004, the median age at death for Indigenous Western Australians was 50 for males and 64 for females, 26 and 18 years lower than for non-Indigenous males and females respectively.
EDUCATION AND TRAINING
Education and training help people to develop the knowledge and skills to enhance their own living standards and those of the broader community. For an individual, educational attainment is widely seen as the key path to a rewarding career. For the state as a whole, having a skilled workforce is vital to supporting ongoing economic development and improvements in living conditions.
An indicator of progress in education and training is the proportion of the state's population aged 25-64 with a vocational or higher education qualification. In Western Australia, the proportion of 25-64 year olds with a vocational or higher education qualification rose from 48% to 59% between 1995 and 2005. The equivalent increase at the national level was from 46% to 58% over the same period.
EDUCATIONAL ATTAINMENT, People aged 25-64 with a vocational or higher education qualification
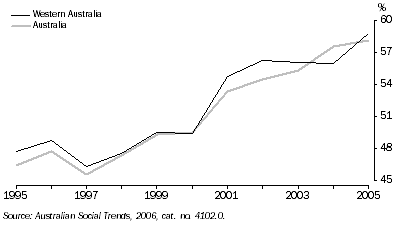
Growth in the proportion of Western Australians with non-school qualifications (other than pre-primary, primary and secondary education qualifications) over the last decade has been driven primarily by people with higher education qualifications (a bachelor degree or above). Between 1995 and 2005, the proportion of people aged 25-64 with a higher education qualification increased from 14% to 21%. The proportion of people whose highest qualification was a vocational qualification rose from 34% to 36% over the same period. In 2005, there was a higher proportion of men (62%) with a vocational or higher education qualification than women (55%), despite a greater increase since 1995 in the proportion of women with this level of qualification - a rise of 40% to 55% for women and 55% to 62% for men. Nationally, the proportion of women (aged 25-64 years) with a vocational or higher education qualification increased from 40% to 54% between 1995 and 2005, compared to an increase from 53% to 62% for men.
The overall increase in educational attainment in Western Australia has been supported by high levels of participation in education and training. Between 1995 and 2005, the proportion of 15-19 year olds who were students in Western Australia rose from 65% to 70% (either in school or studying for a vocational or higher education qualification).
WORK
Paid work provides most people with the economic resources for day-to-day living and their longer term financial needs. Being paid for work contributes to people's sense of identity and self-esteem, as well as contributing to the economic growth and development of the wider community.
A useful indicator is to look at the extent to which people's aspirations for work, or more work, are unsatisfied. The unemployment rate is one such indicator, measuring the proportion of people in the labour force who are not working but actively looking for work. The annual average unemployment rate fell by 2.7 percentage points over 1994-95 to 2004-05 in Western Australia (from 7.4% to 4.7%). Nationally, there was a 3.4 percentage point drop in unemployment over the same period (from 8.7% to 5.3%). However, Western Australia had the lower rate of unemployment in 2004-05 (4.7% compared to 5.3%). Between 1994-95 and 2004-05 in Western Australia, the unemployment rate fell for both males and females, with a 3.3 percentage point fall for males (from 7.6% to 4.3%) and 1.9 percentage point fall for females (from 7.1% to 5.2%).
UNEMPLOYMENT AND UNDERUTILISATION
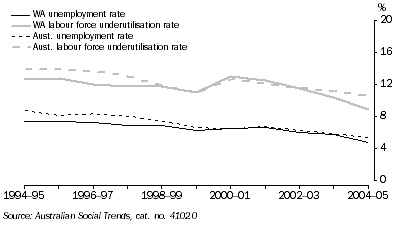
Another useful indicator is the labour force underutilisation rate. It provides a broader view of under-utilised labour than the unemployment rate by looking at the proportion of people in the labour force who are unemployed and underemployed (i.e. working less than 35 hours a week, but wanting and available to work more hours). Between 1994-95 and 2004-05, there was a 3.7 percentage point decrease in Western Australia's labour force underutilisation rate (from 12.6% to 8.9%), whereas nationally there was a 3.3 percentage point drop over the same period (from 13.8% to 10.5%).
THE ECONOMY AND ECONOMIC RESOURCES
STATE INCOME
State income is a measure of Western Australia's capacity to buy goods and services. It is an important determinant of material living standards and is closely linked to other aspects of progress. A good measure of state income is real gross state disposable income per capita, as it takes into account the effects of population growth, inflation and international influences (changes in the terms of trade) on income growth. Another useful indicator is real household final consumption expenditure per capita. This measure allows us to see how increases in state income translate into the consumption of goods and services by households.
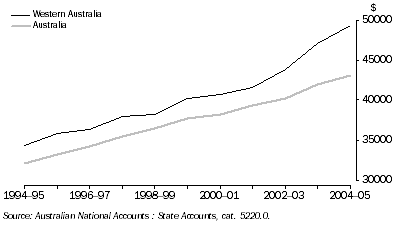
Western Australia has experienced significant growth in real income over the past decade. Between 1994-95 and 2004-05, real gross state disposable income per capita rose by almost $15,000 (44%) - $4,000 more than the increase in Australia's real gross domestic disposable income per capita. In annual average terms, real gross state disposable income per capita grew by $1,500 (4%) per year in Western Australia, higher than the national increase of $1,100 (3%) per year. This disparity has grown larger in the last three years. In 2004-05, Western Australia's real gross state disposable income per capita reached a record high of almost $50,000, exceeding the national figure by over $6,000.
REAL GROSS STATE (DOMESTIC) INCOME PER CAPITA
Household consumption has also grown in Western Australia over the past decade. Household consumption accounts for around 75% of total state consumption of final goods and services. In the decade from 1994-95 to 2004-05, real household final consumption expenditure per capita rose by $5,000 in Western Australia (from $19,000 to $24,000). However, this 26% increase was less than the national rise of 32% over the same period (reaching over $25,000 in 2004-05). More than three-quarters of Western Australia's growth in household expenditure was on Recreation and culture (up $1,000 per person), Miscellaneous goods and services (up $900 per person), Rent and other dwelling services (up $800 per person), Transport (up $700 per person), and Furnishings and other household equipment (up $600 per person).
ECONOMIC HARDSHIP
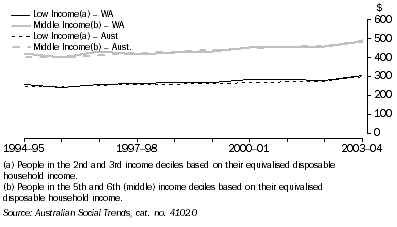
Society generally accepts that people should be able to enjoy some minimum material standard of living. Household income, as measured by average real equivalised disposable income, can indicate whether households, and particularly low income households, are experiencing economic hardship. In Western Australia between 1994-95 and 2003-04, the mean real equivalised weekly disposable income of low income households increased by 15% (from $260 to $300), marginally higher than the 14% rise of middle income households (from $420 to $480). Nationally, income growth of over 20% was recorded for both low and middle income households, greater than in Western Australia over the same period.
MEAN REAL WEEKLY EQUIVALISED DISPOSABLE HOUSEHOLD INCOME
Another indicator of economic hardship is the amount of financial stress suffered by households. Financial stress is defined as either cash flow problems, an inability to raise funds for emergencies or taking a dissaving action. In 2002, 55% of Western Australians had experienced financial stress in the past 12 months - slightly higher than the 53% of households at the national level.
WEALTH
Wealth and income are very closely related. Along with the skills of the workforce, a state's wealth has a major effect on its capacity to generate income. Australia's headline indicator of wealth is real national net worth per capita, however, this measure is not available at the state level. As a result, household wealth statistics are used in this analysis to provide some information about wealth in Western Australia.
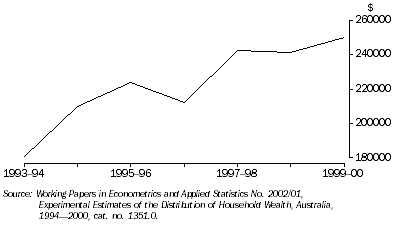
Average household net worth measures the net amount by which assets owned by Western Australian households exceeds their liabilities on average. Between 1993-94 and 1999-2000, average household net worth increased by 38% in Western Australia (from $181,000 to $250,000). Over the same period, national average household net worth rose by an estimated 28% (from $211,000 to $271,000).
AVERAGE HOUSEHOLD NET WORTH, Western Australia
Another source of information is the ABS Survey of Income and Housing. By 2003-04, the mean net worth of Western Australian households had reached $410,000 - $58,000 less than the national average of $468,000. Nearly all of this difference was explained by a $57,000 shortfall in the value of property owned by Western Australian households, compared to Australian households. Western Australians did, however, own a larger value of shares ($22,000 compared to $18,000), vehicles ($18,000 compared to $17,000) and unincorporated businesses ($24,000 compared to $16,000) per household, than the rest of the nation.
HOUSING
Adequate housing is essential to people's wellbeing by providing shelter, security and privacy. Quality of life can be affected by aspects of housing such as size, number of bedrooms, physical condition, proximity to amenities and services, and affordability. Currently, there is no single indicator that summarises the housing situation in Western Australia. However, the quality of housing in Western Australia is generally good and people are continuing to invest in their homes. For instance, dwelling investment rose by 24% in real terms over the decade to 2004-05, thus helping improve the housing stock, and size and condition of housing in Western Australia. There are other indicators of housing that focus on home ownership and housing suitability (whether or not households have sufficient bedrooms).
In 2003-04, 69% of Western Australian households owned their homes outright or were paying them off. This proportion had fallen slightly from 70% in 1994-95. The decline was in line with home ownership nationally, which fell from 71% to 70% of Australian households. Over the same period, the proportion of Western Australian households renting increased marginally from 25% to 26%. This was less than the national increase in households renting, which rose by 2 percentage points - up from 24% to 26%. The slight decline in home ownership in Western Australia and nationally is likely to have been influenced by strong growth in house prices in recent years and its effect on housing affordability.
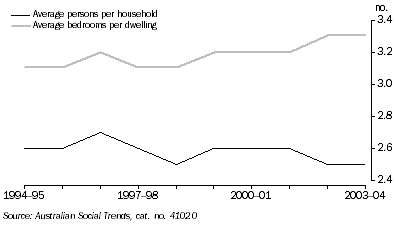
Changes in household size and in the average number of bedrooms per dwelling have led to improvements in housing suitability. Western Australians are increasingly living in houses with more bedrooms and fewer people. The average number of bedrooms per dwelling increased from 3.1 in 1994-95 to 3.3 in 2003-04. At the same time, the size of the average household decreased slightly from 2.6 to 2.5 persons. Nationally, the number of bedrooms per dwelling rose from 2.9 to 3.0, and the average household size fell from 2.7 to 2.5 persons over the same period.
SIZE OF HOUSEHOLDS AND DWELLINGS, Western Australia
Furthermore, in 2003-04, few Western Australians needed more room - only 1.5% of households were in dwellings which required an additional bedroom, lower than the 2.7% of households across Australia. And in the same year, most Western Australians had rooms to spare, with 51% of the state's population living in dwellings with two or more spare bedrooms - much greater than the national average of 42%.
The physical condition and amenities of most dwellings in Western Australia are good. But poor or inadequate housing is currently a problem for some Western Australians, particularly Aboriginal and Torres Strait Islander peoples living in remote areas of the state. In 2002, 50% of all Indigenous people in remote areas were living in dwellings with major structural problems, compared to only 33% of Indigenous people in non-remote areas and 20% of all households in Western Australia (1999). A major reason for this was the higher building and maintenance costs in these distant and hard-to-access communities.
PRODUCTIVITY
A state's productivity is the volume of goods and services it produces for a given volume of inputs. Western Australia achieves productivity growth by producing more goods and services from its labour, capital, land, energy and other resources. Productivity growth benefits the state by generating higher incomes and has the potential to lower output prices.
Productivity can be measured in a variety of ways. Currently, the most comprehensive Australian measure is multifactor productivity for the market sector. The ABS, however, does not produce multifactor productivity for states and territories, but it does produce state estimates of labour productivity - a key driver of economic growth in Western Australia.
Labour productivity is measured by the ratio of output (Gross State Product) to labour input (hours worked). Over the past decade, Western Australia has experienced improved labour productivity, rising 21% between 1994-95 and 2004-05. This compared to a 22% rise in Australian labour productivity over the same period. These results need to be read with some care, as part of the rise in labour productivity will be due to 'capital deepening' (an increase in the ratio of capital to labour).
LABOUR PRODUCTIVITY, Western Australia
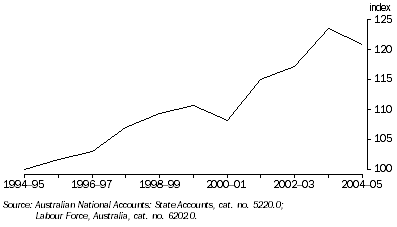
The rapid rise in labour productivity since 2000-01 in Western Australia has coincided with advances in business knowledge and innovation. Investment on research and development indicates the amount of economic resources devoted to the creation and application of knowledge. The proportion of Western Australia's Gross State Product devoted to Research and Development (R&D) expenditure rose from 0.5% in 2001-02 to 0.8% in 2003-04. However, there was no change from 1996-97 (0.8%). By comparison, R&D expenditure accounted for over 1.5% of Australia's Gross Domestic Product per year since 1996-97.
THE ENVIRONMENT
THE NATURAL LANDSCAPE - BIODIVERSITY, LAND AND INLAND WATERS
The Western Australian landscape comprises land, water and the plants and animals that rely on them (biodiversity). They are all very closely linked. Changes in the condition of the state's land, such as salinity, can affect inland waters and biodiversity. The clearing of native vegetation can also impact on biodiversity, and lead to degradation and a decline in the health of inland waters.
Soils are an important natural asset and their degradation is a significant concern to farmers, governments and the general public. Salinity is a naturally occurring condition in Western Australian soils, which has been accentuated by agricultural activities. Dryland salinity is linked to other forms of soil degradation and not only impacts on lost agricultural production but water resources, biodiversity, pipelines, houses and roads.
Salinity occurs when the water table rises, bringing natural salts to the surface, and in sufficient quantities, becomes toxic to most plants. The South West agriculture zone in Western Australia is considered the worst salt affected area in Australia, with widespread clearing of forests and native vegetation for agricultural purposes having contributed to extensive dryland salinity. The 2001 National Land and Water Resources Audit estimated that almost 5 million hectares of agricultural land in Australia was affected by dryland salinity in 2000 and that over three-quarters (4 million hectares) of these areas were in Western Australia.
The economic cost to the state of the effects of dryland salinity was estimated at $660 million in 2000. Over three-quarters ($520 million) of this cost was attributed to additional maintenance and replacement costs required for roads and railways, while around $80 million related to lost agricultural productivity. Dryland salinity can cause the rapid collapse of terrestrial and marine ecosystems and potentially poses a severe threat to biodiversity in Western Australia. The south west area of Western Australia, which is nationally and internationally recognised for the uniqueness and richness of its flora and fauna, is under increasing threat from dryland salinity and other environmental impacts. The 2006 State of the Environment Report (draft) indicates that some 450 plant and 400 animal species are at risk of global or regional extinction as a result of dryland salinity, and that it is likely to reduce animal species by 30% in affected areas.
The clearing of native vegetation is a major contributor to environmental problems occurring in Western Australia. It is estimated that 7% of native vegetation in Western Australia has been cleared since European colonisation - mostly in the state's South West. It is estimated that only 7% of the pre-European vegetation in the entire wheatbelt region of Western Australia has been retained. Since the 1980s the wide scale clearing of native vegetation associated with the agricultural expansion of the state has virtually ceased. The main drivers for current and future native vegetation clearing in Western Australia are population growth in the South West and the expansion of the mining industry across the rest of the state.
THE AIR AND ATMOSPHERE
Global warming is one of the most significant international environmental concerns. Though difficult to predict, there is potential for global warming to have profound consequences for Western Australia. Coastal settlements could come under threat from possible severe flooding and rising sea levels, while agricultural regions could be hampered by the possibility of drought.
The main gases in the atmosphere, nitrogen and oxygen, are almost completely transparent to the sun's rays. But water vapour, carbon dioxide and other naturally present gases form a blanket around the Earth, trapping heat - a process termed the greenhouse effect. Human activities such as burning of fossil fuels and land clearing are increasing the concentration of greenhouse gases in the atmosphere. Based on 2003 emissions, Australia accounts for 4% of total industrialised countries emissions.
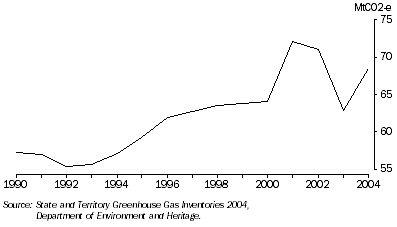
The major progress indicator for the atmosphere is total net greenhouse gas emissions. This refers to the estimated total emissions from human sources less credits from carbon sinks (such as forests). Credits are estimates of how much carbon dioxide has been consumed since 1990. In 2004, Western Australia's net greenhouse gas emissions were estimated to be 69 megatonnes (Mt) of carbon dioxide-equivalent (CO2-e) - 9% higher than in 2003 and 20% above emissions in 1990.
GREENHOUSE GAS EMISSIONS, Western Australia
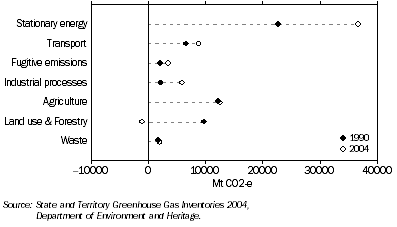
The state's contribution to national greenhouse gas emissions has also grown between 1990 and 2004, increasing from 10% to 12% of Australia's total emissions. Most of this rise has been due to emissions from energy and transport, driven by economic and population growth. Emissions from stationary energy grew by 61% over the period (from 23 to 37 Mt CO2-e), which includes energy consumed by households and energy used for business, manufacturing and commercial purposes.
GREENHOUSE GAS EMISSIONS IN WESTERN AUSTRALIA, By sector
Poor air quality can cause health problems, reduce crop yields, damage infrastructure and harm flora and fauna. A widely used indicator of air quality is the concentration of particles in the atmosphere which have a diameter of 10 micrometres (referred to as PM10). Under the National Environment Protection Measures guidelines, it is considered acceptable for fine particle concentrations to exceed health standards up to five days a year. Based on data from air quality monitoring stations situated around Perth and Bunbury, health standards for PM10 were found to exceed health standards only 1-2 days per year on average between 2000-2004.
Weather conditions such as still air, can affect how long pollutants stay in the air and increase pollution levels. In cooler months, the use of wood heaters has been identified as a major contributor to particles in the air. Further high concentrations from irregular events such as bush fires, can obscure longer term trends in pollution levels - those based on regular sources of pollution such as car emissions.
OCEANS AND ESTUARIES
Western Australia's coastal and marine regions support a large variety of native species. Beaches are also central to the state's culture and lifestyle, providing many recreational opportunities. Economically, the coast is valued for activities such as tourism, commercial fishing, aquaculture, shipping, mining (mineral sands) and offshore oil and gas. In 2001, over 90% of Western Australians lived within 50 km of the coast. This concentration of people along the coastline places considerable pressure on the state's marine environment.
Estuaries face a number of pressures from urban and industrial development, and from disturbance through land use and vegetation clearance in catchment areas. The Estuarine Condition Index was developed by the National Land and Water Resources Audit (NLWRA) to provide a snapshot of estuary health across Australia. In 2002, the NLWRA found that 50% of about 1,000 Australian estuaries were in near pristine condition. Western Australia's estuaries were above the national average, with 55% of them in near pristine condition. At the other end of the scale, 9% of Australia's estuaries were extensively modified or subject to the most extreme pressures, while only 5% of Western Australia's estuaries were extensively modified. The Swan-Canning estuary of Perth and some of the estuaries along the state's south west coast, from Mandurah to Busselton, were rated as extensively modified.
Overfishing can place strain on marine species and affect other species through disruptions to the food chain. Currently, it is not possible to assess the state's progress in terms of sustainable fishing or fishing stocks. Western Australia accounts for one-quarter of Australian fisheries production, the largest share of any state or territory. According to the Australian Bureau of Agriculture and Resource Economics, the gross nominal value of fisheries production in Western Australia was $540 million in 2004-05, a decrease of 10% from 1994-95 ($600 million). The Western Rock Lobster is the state's most prominent fishery, accounting for over one-third of state production and is the most valuable single-species fishery in Australia.
A large number of people visit Western Australia for its marine and coastal features. One particular area of interest is Australia's Coral Coast, which includes the major attractions of Monkey Mia in Shark Bay and the Ningaloo Reef. Shark Bay is one of 16 World Heritage areas of Australia and is a popular tourism destination. The region is home to 4 of the 26 endangered Australian mammals and 35% (over 230 species) of Australia's bird species. It is also renowned for nearly 100 species of amphibian and reptile, large populations of dugong, dolphins and turtles, and the largest seagrass bed in the world. Monkey Mia and the Ningaloo Reef are both biologically diverse marine environments, providing commercial benefits to the state through tourism and fishing. Monkey Mia, a popular location for its dolphins, receives between 80,000-100,000 visitors per year, while the Ningaloo Reef is the longest fringing reef in the world, stretching 260 km.
OVERNIGHT VISITORS(a) TO AUSTRALIA'S CORAL COAST
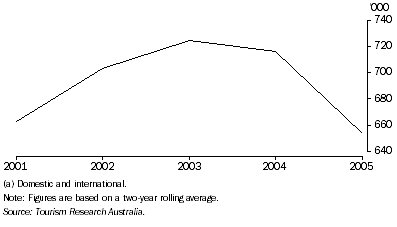
The vast majority of visitors to Australia's Coral Coast are Western Australians (intrastate travellers), accounting for 80% of all overnight visitors to the region in 2005. International and interstate travellers made up an equal share of the remaining 20%. Over the last 5 years, the number of overnight visitors to Australia's Coral Coast has averaged 692,000 per year. In addition to overnight visitors, an average of 320,000 people made day trips to the area in each year since 2001.
The incidence of oil spills is another indicator of marine health. The environmental impact of oil spills depends on their size and location, and weather conditions at the time. Oil spills cause the most damage when they occur close to conservational areas or near to the coast, affecting marine wildlife and other animals higher up the food chain. There were three major oil spills in Western Australian waters between 1988 and 1991, however, no major oil spills were reported in the last decade.
LIVING TOGETHER
FAMILY, COMMUNITY AND SOCIAL COHESION
Family and community are important aspects of society. The strength of people's relationships with their family, friends and the wider community are important ingredients of social cohesion. Most Western Australians live in households as members of a family unit. While couple families are most common in Western Australia, there has been an increase in the proportion of one parent families, along with children living in this type of family.
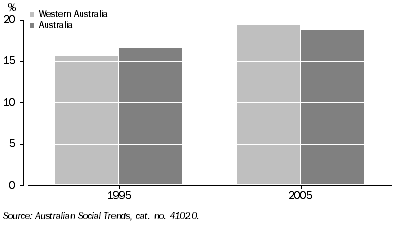
In 2005, lone mother families accounted for 19% (43,000) of all families in Western Australia with children under 15 years of age, an increase from 16% (32,000) in 1995. The proportion of children in lone mother families was marginally higher in Western Australia (19.4%) than nationally (18.7%) in 2005. Ten years earlier it was the reverse with Western Australia (15.6%) having a slightly lower proportion of children in lone mother families than Australia as a whole (16.6%).
PROPORTION OF CHILDREN IN LONE MOTHER FAMILIES
An indicator of children at risk of financial hardship and associated personal development issues is the joblessness of their parents. In Western Australia, 16.5% of children (one in six) under the age of 15 were living in families with no resident parent employed in 2004, a slight decrease from 1995 (17.4%). The proportion of children living without an employed parent was slightly higher in Western Australia (16.5%) than nationally (15.7%) in 2004. There was also a decline in the proportion of couple families with children in Western Australia where neither parent was employed - falling from 7.4% in 1995 to 6.2% in 2005. Nationally, the proportion fell from 8.4% to 5.3% over the same period.
The support carers provide elderly and disabled people is essential to their health and effective social functioning, helping them to realise their full potential as individuals and participants in the community. In 2003, 13% (247,000) of Western Australians cared for someone with a disability and 2% (39,000) were primary carers of a person with a severe or profound disability. These rates were the same as those recorded nationally. In 2003, there were 47,000 (24%) more carers in Western Australia than in 1998. The number of primary carers increased by 3,600 (10%) over the same period, many of whom were women (the proportion of carers who were women rose from 66% to 73%).
Volunteering is one way in which community bonds can be strengthened. More people volunteering their time to do work for an organisation or group can be considered a strong expression of social capital. In 2002, 507,000 (36%) Western Australians aged 18 years and over reported that they had volunteered in the previous 12 months, significantly more than the 325,000 people (26%) in 1995. The equivalent rates of voluntary work at the national level were slightly lower in both 2002 and 1995 at 34% and 24% respectively.
CRIME
Crime takes many forms and can have a major impact on the wellbeing of victims, their families and the wider community. People directly affected by crime can suffer financially, physically, psychologically and emotionally, while perceptions of crime can cause people to restrict their activities and reduce their levels of trust. Other costs to the community include the provision of law enforcement, legal services and corrective services.
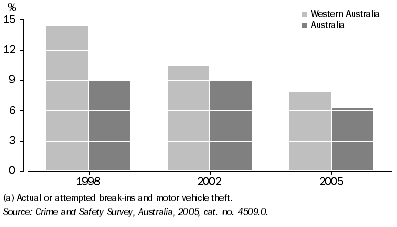
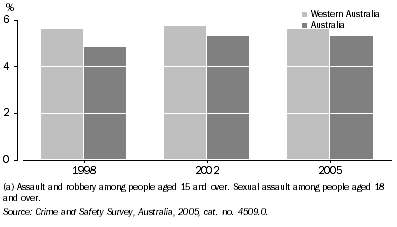
One way to look at progress in this area is to examine changes in victimisation rates for common criminal offences. The two measures presented here are victimisation rates for 'personal' and 'household' crime. Household crime refers to actual or attempted break-ins and motor vehicle theft, while personal crime includes assault, sexual assault and robbery.
In 1998, 14.3% of households in Western Australia were the victims of at least one household crime. This rate was well above the national average of 9.0% and the highest of all states and territories in Australia. Since 1998, the rate in Western Australia has almost halved to 7.8% in 2005, although it still remained above the national rate of 6.2%. The victimisation rate for break-in or attempted break-in declined from 12.4% to 7.2% of all Western Australian households between 1998 and 2005. Over the same period, the victimisation rate for motor vehicle theft halved from 2.4% to 0.9%.
VICTIMS OF HOUSEHOLD CRIME(a)
The rate of personal crime in Western Australia has shown no change between 1998 and 2005. In both years, 5.6% of Western Australians reported being the victim of at least one personal crime. The victimisation rate for personal crime in Western Australia was marginally higher than the national average of 5.3% in 2005. Assault, the most commonly reported personal crime, was reported by 5.2% of the Western Australian population and 4.8% of all Australians in 2005.
VICTIMS OF PERSONAL CRIME(a)
DEMOCRACY, GOVERNANCE AND CITIZENSHIP
National life is influenced by the wellbeing of its individual citizens and the way in which they cooperate with one another. Society can achieve wellbeing through tangible factors such as income, wealth, health and education, but also by less tangible factors such as quality of public life, fairness of society, health of democracy, and active and cooperative community participation. While there is no single progress measure for 'Democracy, governance and citizenship', a range of supplementary indicators shed light on this area.
Western Australians are engaged in three levels of government: Commonwealth (Federal), State and local. While each level of government has different responsibilities and powers, standing for public office in any one of them is an important act of political participation. Currently, Western Australia has 27 members of Federal Parliament - 15 in the House of Representatives and 12 in the Senate. Six of these participants are women, three in each chamber, accounting for 8% and 11% of women in each house of parliament respectively. In the 2004 elections for the House of Representatives, 124 candidates (11%) sought endorsement for Western Australian seats out of a national total of 1,091 candidates and 150 seats.
State Parliament in Western Australia comprises two houses: the Legislative Assembly and Legislative Council. For the 2005 election, prior to the recent enactment of the new 'one-vote one-value' legislation, the Legislative Assembly had members elected from 57 single member electoral districts (34 metropolitan and 23 country). The 34 member Legislative Council had six multi-member regions each having either five or seven members. Elections for both houses are held every four years. A record field of 375 Legislative Assembly and 185 Legislative Council candidates nominated for the 2005 state election. This total of 560 candidates was an increase of 7% over the 2001 field (525 candidates) and 55% over the 1996 field (361 candidates). Another indicator of increased involvement in the political process in 2005 was the registration of 14 political parties compared to only seven for the 2001 election. In 2005, 13 women were successful in being elected to the Legislative Assembly, thereby comprising 23% of its members and a further 14 were elected to the Legislative Council, accounting for over 40% of its membership.
Local Government closely affects the daily lives of Western Australians. There are 142 Local Government Councils in Western Australia and over 1,400 elected members. Local government in Western Australia is very diverse with the population and geographic size of councils differing greatly. The largest council by area is the Shire of East Pilbara (379,000 square kilometres) and the smallest is Peppermint Grove (1.5 square kilometres). Numbers of electors range from under 100 in the country shires of Murchison and Sandstone to over 100,000 in the metropolitan cities of Joondalup and Stirling. In 2005, the average population of each local government authority in Western Australia was around 14,200 people - less than half the Australian average of 30,500.
Elections make government accountable to the electorate by providing the opportunity to vote for an alternative government. Voting in Federal and State elections is compulsory and around 93% of Western Australians regularly turnout to vote. Informal votes, some of which are cast as a protest, generally average between 3-5% of votes cast. Voting in local government elections is optional and the ballot is usually conducted through the post. The participation rate in 2005 local government ballots ranged between 30% and 77% for eligible voters. The average participation across the state was 37% in 2005, compared to 35% in local government elections conducted in 2003. Voter participation tended to be higher for local governments with smaller elector bases; the regional shires of Mt Marshall and Lake Grace had voter turnout of over 65% in 2005. The Town of Cottesloe recorded the highest metropolitan participation rate in 2005 with 55%. Conversely, larger metropolitan electorates generally obtain relatively low voter participation rates, for example the cities of Stirling and Gosnells had participation rates below 35% in 2005.
CONCLUSION
The suite of indicators presented in this article suggests progress in many areas of Western Australian life over the last decade, and stability or regress in others. It is important to recognise that this article does not claim to have included everything that is considered important to the state's progress. Analysis of progress is multidimensional and dimensions of progress are interrelated. Readers should apply their own judgement to decide whether or not the array of measures presented in this analysis implies that Western Australia is, on balance, progressing, and if so, at what rate.
 Print Page
 Print All