Feature Article - Selected Statistics for Aboriginal and Torres Strait Islander People in Western Australia
INTRODUCTION
There have been significant improvements in the range, quality and availability of statistics about Aboriginal and Torres Strait Islander Australians over the past decade, and the ABS continues to increase the breadth and quality of its outputs for this population.
The ABS undertakes ongoing liaison and consultation with Aboriginal and Torres Strait Island communities, organisations and users of Indigenous data. This consultation informs the ABS of existing and emerging priorities and supports the development of strategic directions. Such directions will be articulated in the publication, Strategic Directions in Indigenous Statistics (ABS, 2006, forthcoming).
Aboriginal and Torres Strait Islander people suffer greater ill-health, are more likely to experience disability and reduced quality of life and to die at younger ages, than other Australians. They are also disadvantaged across a range of socio-economic conditions such as income, employment, educational outcomes and housing.
The following two-part article, summarising results for Western Australia from the 2002 National Aboriginal and Torres Strait Islander Social Survey, and the 2004-05 National Aboriginal and Torres Strait Islander Health Survey, showcases the expanded data available about Indigenous social conditions and health.
The terms 'Aboriginal and Torres Strait Islander Australians/people' and 'Indigenous Australians/people' are used interchangeably through the article. Both terms are inclusive and refer to all people of Aboriginal and/or Torres Strait Islander origin who identify as Indigenous.
The Indigenous population is relatively young, with a median age some 15 years lower than the non-Indigenous population. To account for the difference in age structure, any comparisons between Indigenous and non-Indigenous people are presented by age group or by using age standardised rates as appropriate.
NATIONAL ABORIGINAL AND TORRES STRAIT ISLANDER SOCIAL SURVEY, 2002
BACKGROUND
The 2002 National Aboriginal and Torres Strait Islander Social Survey (NATSISS) was the second national social survey of Indigenous Australians conducted by the ABS. The first, undertaken in 1994, arose out of the findings of the Royal Commission into Aboriginal Deaths in Custody.
The 2002 NATSISS included key areas of social concern such as health, education and employment, family and culture, income and housing, and access to information technology. Information was collected from 9,400 Indigenous people aged 15 years and over, including nearly 1,600 in Western Australia (WA). Estimates have been produced at the national and state/territory level and for remote and non-remote areas.
Results from the 2002 NATSISS may be compared with those obtained from the 2002 General Social Survey (GSS) (cat. no. 4159.0) and the 1994 NATSIS (cat. no. 4190.0) for some variables. Other recent ABS sources of information on the Indigenous population are the 2001 Census of Population and Housing (cat. no. 4705.0 and 4713.0) and the 2004-05 National Aboriginal and Torres Strait Islander Health Survey (cat. no. 4715.0).
POPULATION CONTEXT
Estimates based on the 2001 Census of Population and Housing show that 66,000 Aboriginal and Torres Strait Islander people were usual residents of WA, comprising 3.5% of the state's total population. The majority (67%) lived outside the major urban centre of Perth.
The state's Aboriginal and Torres Strait Islander people are a young population with a median age of 20.6 years, around 15 years lower than the median age of 35.4 years for non-Indigenous people. This difference relates to the higher fertility rates and lower life expectancy of the Indigenous population.
LANGUAGE AND CULTURE
Language
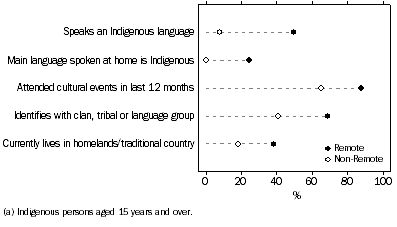
In 2002, over one quarter (27%) of Indigenous people in WA spoke an Indigenous language. This was a higher proportion than at the national level (21%) due in part to a greater share of this state's Indigenous population living in remote areas (47% compared with 27% nationally) where an ability to speak an Indigenous language is more common. Half (50%) the Western Australian Indigenous population living in remote areas spoke an Indigenous language.
Around one in eight Indigenous people in WA (12%) reported that the main language spoken at home was an Indigenous language, with this figure rising to one in four (24%) in remote areas. Indigenous people aged 25-44 years were twice as likely, and those aged 45 years and over nearly four times as likely as people aged 15-24 years to speak an Indigenous language as their main language at home.
Culture
Three quarters (76%) of the Indigenous population in WA reported having attended a cultural event in the last 12 months. The most commonly reported events were funerals (62%) and festivals or carnivals involving arts, crafts, music or dance and sport (49%). In remote areas of the state, almost nine out of ten Indigenous people (88%) had attended a cultural event in the last 12 months compared with 65% in non-remote areas.
Over half (54%) of the Indigenous population in WA identified with a clan, tribal or language group and over one quarter (28%) currently lived in their traditional homelands or country. These characteristics were most common among Indigenous people living in remote areas and among those aged 45 years and over.
SELECTED CULTURAL INDICATORS(a), Western Australia
COMMUNITY AND FAMILY
Participation in community activities and support
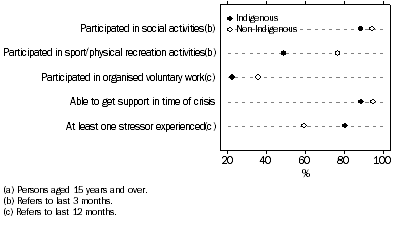
In 2002, 88% of the Indigenous population of WA had been involved in organised social activities in the past 3 months, and nearly half (49%) had participated in organised sport and/or undertaken voluntary work (23%) in the previous year. Nonetheless, Indigenous people were significantly less likely to have been involved in each of these activities than non-Indigenous people.
The large majority of Indigenous people were able to get support in a time of crisis from someone outside their household (89%). However, this was marginally lower than the proportion for non-Indigenous people (95%).
Within the Indigenous population, participation in community activities and access to support were similar for those living in remote and non-remote areas.
Stressors
Western Australia's Indigenous population was significantly more likely than the non-Indigenous population to have reported experiencing at least one stressor in the past 12 months (81% compared with 59%). Among Indigenous people, the most frequently reported stressors were the death of a family member or close friend (45%), a member of the family sent to jail or currently in jail (26%) and serious illness or disability (25%).
While neither sex nor remoteness impacted significantly on Indigenous people's experience of stress, age did to some extent. A higher proportion of people aged 25-44 years (84%) reported at least one stressor in the past 12 months than those aged 15-24 years (74%) or 45 years and over (76%).
SELECTED COMMUNITY INDICATORS(a), Western Australia
Removal from natural family
One in ten (10%) Indigenous people in WA had been removed from their natural family and over half (54%) had either been removed or had relatives removed. These rates were higher than those reported by Indigenous people in any other state/territory, and above the national level (8% for individuals and 38% for self and/or relative).
PERSON OR RELATIVE REMOVED FROM NATURAL FAMILY, States and Territories(a)
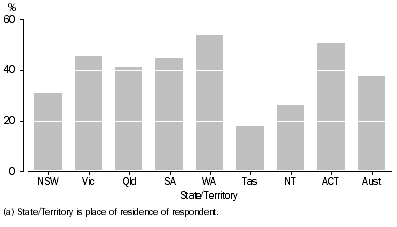
Indigenous people living in non-remote areas of WA were more likely to have been removed or to have had relatives removed from their natural family, than those living in remote areas (60% and 47%, respectively). This was also more common among those aged 25-44 years (57%) and 45 years and over (54%) than for those aged 15-24 years (48%).
HEALTH
Health status
Self-assessed health status provides an indicator of overall health; it reflects an individual's perception of his or her own health. Health status was self-assessed with respondents able to report their health as either 'excellent', 'very good', 'good', 'fair' or 'poor'. In 2002, 35% of Indigenous people in WA rated their health as excellent or very good. This was lower than the 1994 NATSIS result where 47% of Indigenous people in the state rated their health as excellent or very good. Conversely, the proportion rating their health as fair or poor increased from 16% in 1994 to 24% in 2002. Although these shifts are notable they should be viewed with some caution due to the self-reporting nature of the data (for further information see the Explanatory Notes in the publication National Aboriginal and Torres Strait Islander Social Survey, 2002, cat. no. 4714.0).
SELF-ASSESSED HEALTH STATUS, Western Australia
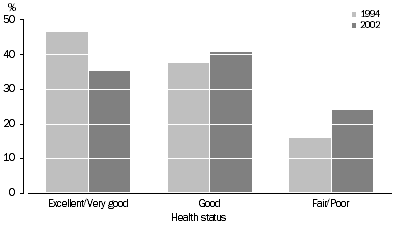
The proportion of Indigenous people in WA who reported their health status as excellent or very good in 2002 (35%) was lower than the national level (44%). In contrast, rates of reported fair or poor health status were similar at the WA (24%) and national (23%) level.
Smoking
Almost half (48%) of the Indigenous population aged 15 years and over in WA were current daily smokers in 2002, a proportion not significantly different from the 51% who reported smoking in 1994. Neither sex, nor remoteness, had a significant impact on whether people were current smokers in 2002. However, Indigenous people who were employed were less likely to be current daily smokers than those who were unemployed (38% compared with 69%).
Consumption of alcohol
In 2002, 28% of Indigenous people aged 15 years or over in WA reported no alcohol consumption in the previous 12 months. This was significantly less than the 38% who reported not having drunk alcohol in the 12 months to 1994.
One in six Indigenous people in WA (16%) reported alcohol consumption in the last 12 months that was classified (by National Health & Medical Research Council guidelines) as 'risky/high-risk'. Those living in remote areas were more than twice as likely to have reported consuming at risky/high risk levels than those in non-remote areas (22% compared with 10%). Although Indigenous males were slightly more likely to have reported consuming alcohol at risky/high risk levels (18%) than were Indigenous females (13%) the difference was not statistically significant.
There was also a slightly higher incidence of risky/high risk consumption reported by people aged 25-44 years (18%) and 45 years and over (16%) than among those aged 15-24 years (11%). The lower reporting by young people may simply reflect the fact that this age group includes people under 18 years for whom alcohol consumption is illegal.
More recent data on self-assessed health status, smoking and alcohol consumption were collected in the 2004-05 National Aboriginal and Torres Strait Islander Health Survey (NATSIHS). Further information on these topics is provided in the companion article which outlines results from this survey.
EDUCATION
Attending an educational institution
Information about attendance at a post school educational institution was collected by NATSISS for the first time in 2002. Estimates indicate that 3% of Indigenous people aged 18 years and over in WA were attending a University or other tertiary institution compared with 7% of the non-Indigenous population. Other post school educational facilities (including TAFE, technical and business college) were being attended by 8% of the Indigenous population and 6% of the non-Indigenous population.
Educational attainment
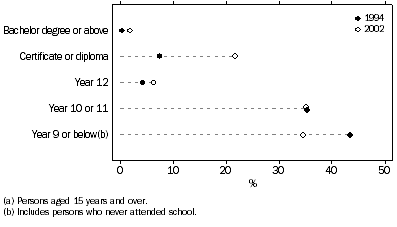
Between 1994 and 2002 there was significant improvement in the educational attainment of Indigenous people aged 15 years and over in WA. Over this period, the proportion with a non-school qualification trebled from 8% to 24%. However, the 24% of Indigenous people with a non-school qualification remained well below the 55% recorded for non-Indigenous people.
EDUCATIONAL ATTAINMENT OF INDIGENOUS PEOPLE(a)(b), Western Australia
WORK
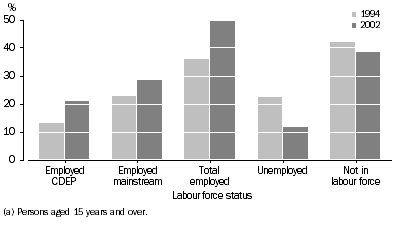
In 2002, the proportion of Indigenous people aged 15 years or over in WA who were employed was 50%, significantly higher than the 36% recorded in 1994. While the Community Development Employment Projects scheme (CDEP) contributed substantially to employment growth in this period, the proportion of Indigenous people employed in mainstream jobs also rose, from 23% to 29%. At the time of interview the proportion of Indigenous people in WA who were unemployed was considerably less than it had been in 1994, 12% compared with 22%.
LABOUR FORCE STATUS OF INDIGENOUS PEOPLE(a), Western Australia
A higher proportion of the Indigenous population living in remote (59%) than non-remote areas (41%) of WA were employed in 2002. This can be linked to the important role the CDEP scheme plays in providing employment. In remote areas of WA, 36% of Indigenous people were employed through CDEP compared with 8% in non-remote areas. The comparatively high rate of employment in remote areas of WA may also be one reason for the state having a greater share of its Indigenous people employed (50%) than the national average (46%).
Non-school qualifications had a positive influence on employment outcomes in WA. Seven in ten (71%) of the state's Indigenous population no longer at school with qualifications were employed compared with 43% of those who did not have a qualification.
INCOME
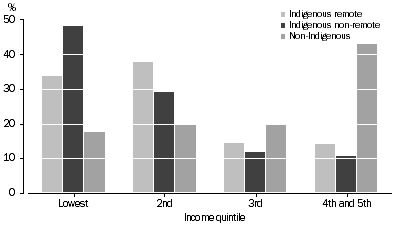
The gap between Indigenous and non-Indigenous households' incomes in WA remains. In 2002, Indigenous households (with a reference person aged 18 years and over) earned 58% of the gross income of non-Indigenous households ($376 per week compared to $652 per week), on average, after adjusting for differences in household size and composition. Reflecting this, Indigenous Western Australians were over-represented in the lowest and second household income quintiles and under-represented in the third, fourth and highest household income quintiles.
Indigenous people living in remote areas of the state were significantly less likely to be in the lowest income quintile than those living in non-remote areas (33% compared with 48%). They were also less likely to be in the lowest quintile than all Indigenous people living in remote areas of Australia (33% compared with 41%).
HOUSEHOLD INCOME QUINTILES, Western Australia
In the eight years to 2002, there was a decline, from 58% to 50%, in the proportion of Indigenous people in WA who reported government pensions and allowances as their main source of personal income.
HOUSING
Tenure
Around three quarters (77%) of Indigenous people in WA lived in rented accommodation in 2002. This rate has not changed significantly since 1994 (79%). Over this period, however, there was a fall in the proportion renting from the State Housing Authority (54% to 32%) and an increase in the share renting from Indigenous Housing Organisations/Community housing (16% to 23%) and other private rental providers (9% to 22%).
Just under one in five Indigenous people in WA (18%) were living in dwellings either owned or being purchased in 2002. Although up slightly from 14% in 1994, this difference was not statistically significant. While still at a low rate, home ownership (with or without a mortgage) was more common among Indigenous people living in non-remote (25%) than remote areas (11%) of the state.
Mobility
While two thirds of Indigenous people in WA had lived in the same dwelling for the 12 months to 2002, 25% had moved once and a further 9% had moved twice or more during that period. Housing-related and family reasons were the most frequently cited reasons for the move(s). Moving house was more common in remote areas of the state (41%) than non-remote areas (27%).
Quality of housing
Based on information obtained from nominated household spokespersons, some 41% of Indigenous people in WA were living in a dwelling which had structural problems (50% in remote areas and 33% in non-remote areas) in 2002. This was despite 61% living in dwellings where repairs and maintenance had been carried out in the previous year (53% in remote areas and 69% in non-remote areas).
Overcrowding was prevalent, with 25% of Indigenous people in WA living in a dwelling that required at least one extra bedroom. The incidence of overcrowding was much higher in remote areas (39%) than non-remote areas (13%).
LAW AND JUSTICE
Victimisation
In 2002, more than one quarter (26%) of Indigenous Western Australians reported that they had been a victim of physical or threatened violence in the previous 12 months, double the rate reported in 1994 (13%). The WA rates were similar to those reported nationally (24% in 2002 and 13% in 1994).
Within WA, rates of victimisation were similar for people living in remote and non-remote areas (27% compared with 25%) and for men and women (again, 27% compared with 25%). However, rates for people aged 15-24 years (32%) were higher than for those aged 25-44 years (29%) and 45 years and over (14%).
After adjusting for age differences between the Indigenous and non-Indigenous populations, Indigenous persons aged 18 years or over in WA were more than twice as likely as non-Indigenous people to have been a victim of physical or threatened violence in the last 12 months (21% compared with 10%).
Involvement in the criminal justice system
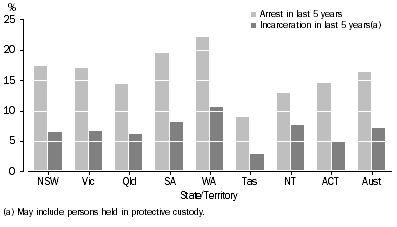
Indigenous people in WA continue to have high rates of contact with the criminal justice system and are over-represented in the prison system. In 2002, a higher proportion of Indigenous people aged 15 years or over had been arrested (22% compared with 16%) and/or incarcerated (11% compared with 7%) in the past 5 years than was reported nationally. Arrest and incarceration rates were also higher in WA than in all other states and territories.
ARREST AND INCARCERATION OF INDIGENOUS PEOPLE, States and Territories
Males were far more likely than females to report that they had been arrested (33% compared with 13%) and incarcerated (17% compared with 5%) in the last five years. Similarly, unemployed Indigenous people were twice as likely as those currently employed to have been arrested in the last five years (42% unemployed, 19% employed) and more than three times as likely to have been incarcerated over the same period (29% unemployed, 8% employed).
END NOTE
The 2002 NATSISS provided a large and rich source of social data about Indigenous people aged 15 years and over at both the national and state/territory level. The first part of this article has provided an overview of the key results for Western Australia.
The ABS plans to conduct a further National Aboriginal and Torres Strait Islander Social Survey in 2008. This will provide an opportunity to build on the information collected in 2002 and enable the social circumstances of Indigenous people to continue to be compared across years.
For further information about the 2002 NATSISS or other ABS Indigenous statistical outputs please visit the ABS website <www.abs.gov.au> and under Themes, select Indigenous.
NATIONAL ABORIGINAL AND TORRES STRAIT ISLANDER HEALTH SURVEY, 2004-05
BACKGROUND
The National Aboriginal and Torres Strait Islander Health Survey (NATSIHS) collected information relating to health status, long-term health conditions, health actions taken, lifestyle factors which may influence health, and socioeconomic circumstances.
The survey was conducted between August 2004 and July 2005 and builds on information from the Indigenous supplement to the 2001 National Health Survey (NHSI). The NATSIHS was designed to provide comparisons with selected results for the non-Indigenous population from the 2004-05 National Health Survey (NHS). A number of data items in the NATSIHS were also collected in the 2002 National Aboriginal and Torres Strait Islander Social Survey (NATSISS), which was reported in the first part of this article.
The sample size for the 2004-05 NATSIHS was approximately 10,400 Indigenous persons in both remote and non-remote areas throughout Australia. The Western Australian share of the national sample was around 14% or nearly 1,500 people.
This second part of the article summarises selected results from the NATSIHS for Western Australia. Where applicable, data items are compared with national and/or other states' results. For some aspects of health there are also comparisons with the non-Indigenous population.
The Indigenous population is relatively young, with a median age of 20.6 years compared to 35.4 years for the non-Indigenous population. As age is closely associated with health, care should be taken when comparing information for these two populations. To account for differences in the age structure, comparisons between Indigenous and non-Indigenous people are presented by age group or by using age standardised rates as appropriate.
HEALTH STATUS
In WA over three quarters (78%) of Aboriginal and Torres Strait Islander people aged 15 years and over considered their health to be 'good', 'very good' or 'excellent' in 2004-05. This was the same as the national rate in the 2004-05 NATSIHS and similar to that reported for the state in the 2002 NATSISS (76%).
Although the same proportion of Indigenous people in WA assessed their health as 'good', 'very good' or 'excellent' as at the national level, there were differences in the distribution of these ratings. In WA a lower proportion rated their health as 'very good' or 'excellent' (36% compared with 43% nationally) and a higher proportion assessed their health as 'good' (42% compared with 35% nationally). 'Fair' or 'poor' health was reported by 22% of Indigenous people in WA and for Australia as a whole.
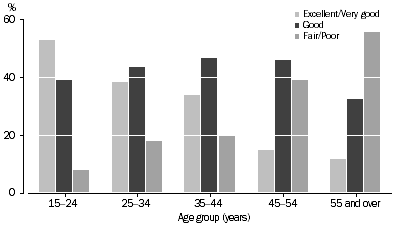
Reflecting the strong relationship between age and health, young Indigenous people (aged 15-24 years) in WA were far less likely to report fair/poor health than were Indigenous people aged 55 years and over (8% compared with 56%). After adjusting for age differences between the Indigenous and non-Indigenous populations, Indigenous people were nearly twice as likely to report their health as fair or poor.
SELF-ASSESSED HEALTH STATUS OF INDIGENOUS PEOPLE BY AGE, Western Australia
 'FAIR/POOR' SELF-ASSESSED HEALTH, Western Australia
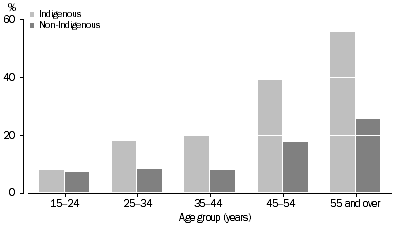
While a slightly lower proportion of Indigenous people living in remote areas in WA rated their health as fair/poor (19%) than did those living in non-remote areas (25%), the difference was not statistically significant.
SOCIAL AND EMOTIONAL WELL-BEING
The 2004-05 NATSIHS collected information on the social and emotional well-being of Indigenous adults (aged 18 years and over) for the first time. Selected questions from the SF-36 and the Kessler Psychological Distress Scale were used, along with questions about feelings of anger, the impact of psychological distress, stressors and cultural identification. At the national level detailed analytical work is underway to assess their suitability as indicators of well-being for Indigenous people.
In response to questions about positive well-being (from the SF-36), more that half the Western Australian adult Indigenous population reported being happy (72%), calm and peaceful (57%) and/or full of life (55%) all or most of the time, while just under half (47%) said they had a lot of energy all or most of the time. These rates were very similar to the national figures for these response categories.
Responses to questions from the Kessler Psychological Distress Scale showed 11% of Indigenous adults in WA reported feeling so sad nothing could cheer them up and 10% were nervous all or most of the time, while 8% said they felt without hope all or most of the time. A higher proportion of Indigenous adults in WA reported feeling restless (13%) and/or that everything was an effort (18%) all or most of the time. All responses related to the four week period prior to interview.
LONG-TERM HEALTH CONDITIONS
In 2004-05, nearly two thirds (62%) of Indigenous people in WA reported at least one long-term health condition. This proportion was similar to the national figure of 65%, with no significant difference in the prevalence of long-term health conditions in remote and non-remote areas of the state.
In WA, eye/sight problems were the most commonly reported conditions (29%), followed by back problems (15%), ear/hearing problems and asthma (each 14%) and heart and circulatory diseases (12%).
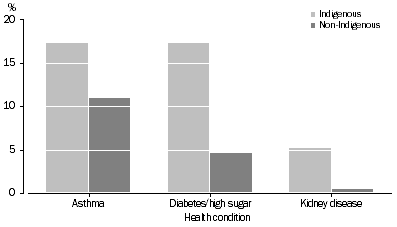
After adjusting for differences in age, Indigenous people in WA were 1.2 times more likely than non-Indigenous people to have reported no long-term health conditions. However, asthma, diabetes (including high sugar levels) and kidney disease were three conditions where prevalence remained considerably greater for Indigenous people after standardising for age.
PREVALENCE OF SELECTED HEALTH CONDITIONS, Western Australia
Asthma
Around one in seven Indigenous people in WA (14%) reported having asthma. After standardising for age, Indigenous people in WA were 1.6 times more likely to report asthma than non-Indigenous people.
The overall incidence of reported asthma in WA was similar to the Australian figure of 15%. Victoria had the highest reported incidence of asthma (20%) and the Northern Territory the lowest at 8%.
The reporting of asthma was much higher among Indigenous females than males. Nearly one quarter (23%) of Indigenous females in WA reported asthma as a long-term health condition, compared with 10% of males. Consistent with national figures, Indigenous people living in non-remote areas of the state also reported a higher incidence of asthma (17%) than those living in remote areas (11%).
Diabetes/high sugar levels
Diabetes (including high sugar levels) continues to be a significant health issue among the Indigenous population. Nearly one in ten Indigenous people in WA (9%) reported having diabetes, and after adjusting for age differences, they were almost four times more likely than non-Indigenous people to have reported this condition.
The reported incidence of diabetes among Indigenous people in WA (9%) was higher than for any other state or territory and above the national figure of 6%. South Australia and the Northern Territory (each with 8%) also had rates higher than the national average.
Within WA there was no significant difference in the prevalence of diabetes among Indigenous people living in remote and non-remote areas. The pattern was different for Australia as a whole, with diabetes almost twice as prevalent among Indigenous people in remote areas (9%) as it was in non-remote areas (5%).
Kidney disease
The 2004-05 NATSIHS collected information from private dwellings only and not from health care facilities. Since the treatment of kidney disease accounts for around one third of all hospital admissions of Indigenous people these results may underestimate the prevalence of kidney disease in the Indigenous population. For further information about hospitalisations of Indigenous people see The Health and Welfare of Australia's Aboriginal and Torres Strait Islander Peoples 2005 (cat. no. 4704.0).
Kidney disease was reported by 3% of Indigenous people in WA and the Northern Territory, slightly higher rates than for the other states and territories, and above the national rate of 2%. The reported incidence of kidney disease was marginally higher in remote than non-remote areas of WA, however the difference was not statistically significant.
After adjusting for age differences, rates of kidney disease were more than ten times higher in the Indigenous population than in the non-Indigenous population.
HEALTH-RELATED ACTIONS
Health-related actions and access to health professionals and services are important factors in the prevention and management of health conditions. In 2004-05, Indigenous people in WA reported having consulted health professionals (other than dentists) more frequently than non-Indigenous people.
Consultations with health professionals
Nearly one in five Indigenous people in WA (19%) reported having visited a doctor (General Practitioner or Specialist) in the two weeks prior to interview, 16% had consulted an 'other' health professional (e.g. Aboriginal health worker or nurse), 7% had visited the casualty or outpatients department of a hospital, and 3% (of people aged two years and over) had seen a dentist.
After adjusting for age differences between the two populations, Indigenous people in WA were equally as likely as non-Indigenous people to have visited a doctor, a little more likely to have consulted an 'other' health professional and three times as likely to have visited the casualty or outpatients department of a hospital in the two weeks before the survey. Indigenous people were less than half as likely as non-Indigenous people to have seen a dentist during that period.
'Other' health professionals, because of their presence in communities, were more likely to have been consulted by Indigenous people in remote areas (23%) than non-remote areas (10%) of WA.
Hospital admissions
Nearly one in five Indigenous people in WA (19%) had been admitted to hospital in the 12 months prior to the survey, well above the national rate (16%). The Northern Territory was the only jurisdiction with a higher proportion of hospital admissions (22%).
After adjusting for age differences between the two populations, Indigenous people in WA were 1.4 times more likely than non-Indigenous people to have been hospitalised in the 12 months prior to interview.
Whether a person lived in a remote or non-remote area of the state had no statistically significant impact on their likelihood of hospitalisation.
Oral health
Among Indigenous people aged 15 years and over in WA, 17% had never visited a dentist or health professional about their teeth. This proportion was twice as high for people in remote areas (24%) as for those living in non-remote areas (12%).
A higher proportion of Indigenous people in WA reported having never visited a dentist about their teeth than was reported at the national level (17% compared with 11%). Indigenous people in non-remote areas of WA were twice as likely to report having never visited a dentist as those in non-remote areas overall.
HEALTH RISK FACTORS
Health risk factors affect the onset and prognosis of a variety of chronic diseases. Environmental factors from cultural, socioeconomic and physical domains have also been shown to have a strong association with both disease and health status. The 2004-05 NATSIHS collected information about health-related aspects of lifestyle, such as smoking, alcohol consumption, substance use, diet, exercise and immunisation levels.
Smoking
In 2004-05 nearly half (44%) of the adult Indigenous population in WA were current daily smokers; that is, people who smoked on average, one or more cigarettes per day. The Western Australian smoking rate was six percentage points lower than the national figure of 50%. The two territories had the highest and lowest recorded rates of adult smokers, with the Northern Territory at 54% and the Australian Capital Territory at 41%.
The proportion of Indigenous men in WA who were smokers (45%) was considerably lower than at the national level (53%). This was particularly so in non-remote areas of the state where 36% were smokers compared with 51% across non-remote areas overall. There was no significant difference in the smoking rates for Indigenous women in WA and Australia as a whole.
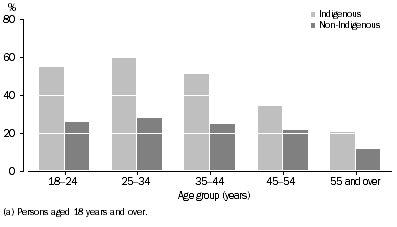
In Western Australia, smoking was more prevalent among Indigenous than non-Indigenous adults of both sexes, and in every age group. After adjusting for age differences, Indigenous adults were twice as likely as non-Indigenous adults to be current daily smokers.
CURRENT DAILY SMOKERS(a), Western Australia
Alcohol consumption
In 2004-05, nearly one in five Indigenous adults in WA (19%) reported having consumed alcohol at 'risky/high risk' levels in the week prior to interview. Along with Queensland, this was the highest reported rate at the state/territory level, and above the national figure of 16%. (Risk level was based on Australian Alcohol Guidelines, October 2001.)
Overall, Indigenous people in remote areas of WA were more likely to report having consumed alcohol at 'risky/high risk' levels than people in non-remote areas (23% compared with 15%).
Indigenous men (22%) in WA were more likely than Indigenous women (16%) to have reported drinking at 'risky/high risk' levels in the week prior to the survey. This applied across all age groups, with Indigenous men in the 35-44 years age group most likely to have reported consuming alcohol at 'risky/high risk' levels (29%). In contrast, the proportion of Indigenous women reporting 'risky/high risk' drinking was highest for those in the 18-24 years age group (23%) and steadily declined to 10% for those aged 45 years and over.
'RISKY/HIGH RISK' ALCOHOL CONSUMPTION (a) BY AGE, Western Australia
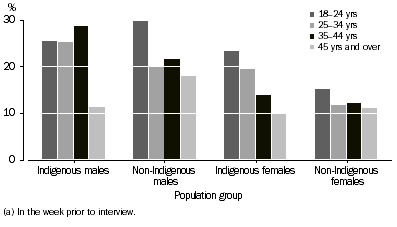
After adjusting for age differences, Indigenous and non-Indigenous people in WA reported similar rates for 'risky/high risk' drinking.
Body mass
The proportion of people that are overweight or obese within a given population can be determined by first calculating an individual's Body Mass Index (BMI) score (from reported information on height and weight) then grouping people into BMI categories. In the 2004-05 NATSIHS, height and weight information could not be obtained from 28% of Indigenous people in WA, a much higher level of non-response than at the national level (17%).
Among Indigenous people aged 15 years and over in WA, 30% were recorded in the underweight/normal or healthy weight range for their height, with a further 21% classified as overweight and obese respectively. After adjusting for non-response the proportion of Indigenous people in WA who were overweight or obese was 59%, similar to the Australian figure of 57%. Victoria had the lowest proportion of its Indigenous population in the overweight/obese category (48%) and South Australia the highest (64%).
For younger (15-24 years) and older (45 years and over) age groups there were higher overweight/obesity rates among Indigenous females than males in WA. The reverse applied for the 25-34 and 35-44 year age groups.
OVERWEIGHT/OBESE, Western Australia
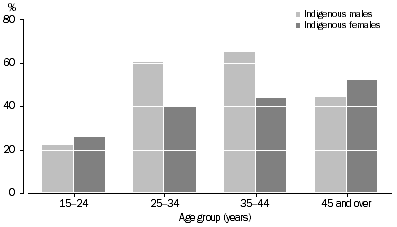
After adjusting for age differences between the two populations and non-response, Indigenous people were 1.3 times more likely than non-Indigenous people in WA to be classified as overweight or obese.
Dietary behaviours
In 2004-05, the majority of Indigenous people aged 12 years and over in WA reported eating vegetables (94%) and/or fruit (85%) daily. These figures were consistent with national averages (95% for vegetables and 86% for fruit).
Fruit and vegetables may have been less accessible to Indigenous people in remote areas of WA, where nearly one quarter (24%) reported no usual daily fruit intake, compared with 8% in non-remote areas. The disparity was even greater for vegetables, 12% of people in remote areas reporting no usual daily intake compared with 1% in non-remote areas of the state.
Over three quarters, (78%) of Indigenous people in WA either sometimes (22%) or usually (56%) added salt after cooking. Indigenous people in remote areas (86%) were more likely than those in non-remote areas (70%) to report sometimes or usually adding salt after cooking.
Seventy eight percent of Indigenous people in WA usually drank whole (full-cream) milk in 2004-05, with 17% reporting using reduced fat or skimmed milk. Within the state, those living in remote areas (87%) were more likely to drink whole milk (including full cream powdered milk) than those living in non-remote areas (70%).
Immunisation
Sixty per cent of older Indigenous people (aged 50 years and over) in WA had been vaccinated against influenza in the 12 months prior to the survey and more than one third (35%) had been vaccinated against pneumonia in the last five years. Immunisation rates for both diseases were higher for women than men, and in remote rather than non-remote areas of the state.
WOMEN'S HEALTH
In 2004-05, the majority of Indigenous women in WA aged 18-64 who had children reported having breastfed them (95%). This was a higher proportion than the national figure of 84%. Of children aged under four years in WA, 79% had been breastfed for at least some period, with 30% being breastfed at the time of the survey.
The proportion of Indigenous women in WA aged 40 years and over who reported having regular mammograms was 27%, a slightly lower proportion than nationally (32%). The proportion of Indigenous women in remote areas of WA having regular mammograms (34%) was higher than in the non-remote areas (18%).
Just under half (48%) of Indigenous women aged 18 years and over in WA reported having regular pap smear tests, the equivalent national figure was just over half (52%). Of Indigenous women 18 years and over in WA 14% reported never having had a pap smear test.
In 2004-05 condoms were the most commonly used form of contraception reported by Indigenous women in WA (21%), followed by the contraceptive pill (11%) and the contraceptive injection (DepoProvera) (9%). In addition 13% of Indigenous women in remote areas of the state and 4% in non-remote areas reported using a contraceptive implant (Implanon), which can prevent pregnancy for up to three years.
FURTHER ANALYSIS AND OTHER OUTPUTS
The second part of this article showcases a selection of data available for WA from the 2004-05 National Aboriginal and Torres Strait Islander Health Survey (NATSIHS). A national publication (cat. no. 4715.0) is available free of charge from the ABS web site <www.abs.gov.au>. A series of state level tables, from which the data in this article is drawn, are also available free on the ABS web site (cat. no. 4715.5.55.005). A Users Guide (cat. no. 4715.0.55.004) was released in May 2006 while a Summary Booklet (cat. no. 4715.0.55.006), Confidentialised Unit Record File (cat. no. 4715.0.55.001) and associated Information Paper (cat. no. 4715.0.55.002) are scheduled for release later this year. Subject to confidentiality and sampling variability constraints, customised tabulations may be available on request and for a fee.
 Print Page
 Print All