|
|
HOW AUSTRALIA IS AGEING
The publication Census of Population and Housing: Ageing in Australia, 2001 (cat. no. 2048.0) is due for release on 13 October 2003. While the major focus of this publication is on the number and characteristics of older Australians - persons aged 65 years and over - the ageing process in Australia is also explored by examining other age groups including mature age persons (45-64 years) and the very old (85 years and over), and by comparing 2001 census results with data from previous censuses. It will be a useful resource for agencies with ageing policy responsibilities, researchers and the Australian community in general.
Topics included in the publication are:
- Population: an analysis of the current demographic structure of the Australian population and how it has changed over the last century, and the geographic distribution of the older population across Australia. While the total Australian population increased around five fold during the last century, the number of older people has increased over fifteen fold. Older people comprised 4% of the population in 1901, increasing to 13% in 2001, and is projected to form between 29% and 32% of the population by 2101.
One of the main factors driving the ageing of the population is the declining fertility rate. The post-World War II baby boom saw the fertility rate reach a peak of 3.6 babies per woman in 1961, after which it has generally been declining. In 2001, the fertility rate was 1.7, which is well below replacement level. Another contributing factor to the ageing of the population is the increasing life expectancy. At the turn of the last century, the average life expectancy at birth was below 60 years for both males and females. In comparison, in 2001, a man was expected to live to 77 years while a woman was expected to live to 82 years.
South Australia had the highest proportion of older people in 2001 (15%) followed by Tasmania (14%), both with a median age of 37 years (compared with 35 years for Australia as a whole). The Northern Territory had the youngest age structure with older people comprising only 4% and a median age of 29 years. In general, net interstate migration flows of older persons between the 1996 and 2001 censuses were northwards up the east coast, with Queensland experiencing the largest gain, and a smaller number westwards to Western Australia.
- Cultural diversity: investigated with identifiers such as Indigenous status, country of birth, proficiency in spoken English and religious affiliation. Of the 2.4 million older Australian residents in 2001, 31% were born overseas, with the most common birthplace being the United Kingdom and Ireland followed by Italy. The proportion of older persons is greater amongst the overseas-born population (18%) than for the Australian-born population (11%). This proportion varies with country of birth. Some 42% of Italian-born people living in Australia were aged 65 years and over in 2001, while those born in countries such as Vietnam, the Philippines and Malaysia have younger age structures, with less than 7% being older persons. This variation reflects the changing immigration policies of different governments over time, such as the significant immigration intake of young adults from Europe immediately following World War II, and more recently, settlers have been attracted from non-European origins, especially Asia.
- Living arrangements: reports on who older persons are living with and the type of housing they are living in, with focus on particular interest groups, including Indigenous persons, persons born in other than predominantly English speaking countries and lone persons. While nearly two-thirds of Australia's older people (62%) continue to live in family households (usually with their partner), recent trends such as low fertility, smaller families, higher incidence of childlessness, and increased divorce rates, have meant that the number and proportion of older persons living alone have increased and are likely to increase in the future. Over the thirty years to 2001, the proportion of older persons living alone has increased from around one in five to one in four. A further 7% of older people live in non-private dwellings, mainly in cared accommodation such as nursing homes, and accommodation for the retired/aged.
Home ownership is highest amongst older persons with three-quarters of those aged 65 years and over living in private dwellings that were fully owned. A further 4% were living in homes where mortgage payments were still being made. Renting is highest amongst those in their twenties, just over 40%, decreasing to 12% for older persons who were predominantly renting from private landlords or real estate agents (42%) and government housing authorities (39%), while a further 6% were renting through community or cooperative housing groups.
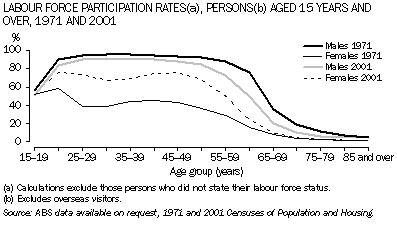
- Work and economic environment: focuses on the participation of mature age and older persons in the labour market and how this has changed over time. It also includes an analysis by industry and occupation, as well as hours worked and levels of income. Labour force participation in Australia has undergone significant changes over the last few decades. In general, the participation rates for men have declined, while the rates for women have been on the increase. In 1971, 89% of mature age men (aged 45-64 years) were participating in the labour force, i.e. were either employed or unemployed, decreasing to 77% in 2001. At the same time, the rate for mature age women increased from 32% to 58%. This increase for women reflects changes in society and the economy such as a general acceptance of women in the work force, and an increase in the availability of flexible and part-time work, influenced by the growth of service industries such as finance and tourism, allowing women to participate in paid work while raising children. The participation rate of older persons has dropped from 12% in 1971 to 8% in 2001.
The industry with the oldest workforce in 2001 was Agriculture, forestry and fishing. This industry was characterised by a median age of 45 years, with one in ten workers aged 65 years and over. The Education industry also had an older workforce with a median age of 43 years, but only 1% were older workers. Industries with the youngest median age were Accommodation, cafes and restaurants (32 years) and Retail trade (31 years).
- Transport: examines the number of registered motor vehicles garaged in households of older persons, and the method of travel that older people use to travel to work. Almost half of older persons reported one motor vehicle garaged at their household on 2001 census night, while some 17% reported that there was no vehicle garaged.
- Education: an analysis of the formal education of older persons and their attendance at educational institutions. Some 41% of older persons reported having completed non-school qualifications in 2001, with most of these (56%) holding a certificate level qualification, 20% a diploma or advanced diploma and 25% a bachelor degree or higher. In comparison, 56% of 25-34 year olds had completed non-school qualifications in 2001. The lower levels of completion by the older age groups reflect they had fewer opportunities as well as lower demand in the workplace for higher educational qualifications at the time they left school. This will mean increased levels of non-school qualifications for successive generations of older people.
- Technology: reports on the use of personal computers and the Internet by older persons and the association between this use and factors such as income, education and geographic location. While surveys show there has been a growth in the use of computers by older persons over the last few years, they were much less likely to use a computer at home in the week prior to the 2001 census than younger age groups. One in ten older persons reported such computer usage, compared with over half of people aged 15-44 years. Some 6% of older persons accessed the Internet during that time. Older persons possessing higher educational qualifications, earning a higher income or living in rural areas were more likely to use these technologies. This higher proportion of computer use and Internet access by older Australians in rural areas is associated with the continued strong growth in the use of such technology by farmers.
| To order a copy of this publication, complete and return the attached order form, or order online via the ABS website at www.abs.gov.au.
 (90k)
(90k) |
|
|
 Print Page
 Print All