ANALYSIS AND COMMENTS
BALANCE ON GOODS AND SERVICES
The trend estimate of the balance on goods and services in January 2008 was a deficit of $2,521m, an increase of $109m (5%) on the revised deficit in December 2007.
In seasonally adjusted terms, the balance on goods and services in January 2008 was a deficit of $2,723m, an increase of $786m (41%) on the revised deficit in December 2007.
EXPORTS OF GOODS AND SERVICES
The trend estimate of goods and services credits rose $176m (1%) between December 2007 and January 2008 to $18,656m.
In seasonally adjusted terms, goods and services credits rose $322m (2%) to $19,020m. Other goods rose $301m (28%) and rural goods rose $25m (1%) while non-rural goods fell $6m. Services credits rose $1m.
Exports of goods
GOODS CREDITS
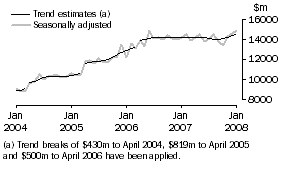
RURAL GOODS
The trend estimate of rural goods exports rose $47m (2%) to $2,120m.
In seasonally adjusted terms, exports of rural goods rose $25m (1%) to $2,180m.
The components contributing to the rise in the seasonally adjusted series were:
- cereal grains and cereal preparations, up $36m (11%)
- other rural, up $35m (4%).
Partly offsetting these effects was the meat and meat preparations component, down $39m (7%).
In original terms, exports of rural goods fell $411m (18%) to $1,864m.
Non-rural goods
The trend estimate of non-rural goods exports rose $76m (1%) to $11,169m.
In seasonally adjusted terms, exports of non-rural goods fell $6m to $11,333m.
Components falling in seasonally adjusted terms were:
- metals (excluding non-monetary gold), down $441m (32%)
- coal, coke and briquettes, down $90m (5%)
- other non-rural (including sugar and beverages), down $71m (6%).
Components that rose in the month included:
- metal ores and minerals, up $312m (10%)
- other mineral fuels, up $139m (10%)
- other manufactures, up $63m (5%).
In original terms, exports of non-rural goods fell $2,026m (17%) to $10,081m.
The main movements in the original series contributing to the seasonally adjusted series were:
- metals (excluding non-monetary gold), down $561m (40%), compared to an average December to January fall of 4% over the previous three years, with:
- aluminium, down $192m (39%) with volumes down 41% and prices up 4%
- copper, down $150m (39%) with volumes down 38% and prices down 2%
- lead, down $129m (75%) with volumes down 70% and prices down 14%.
- metal ores and minerals, down $457m (13%), compared to an average December to January fall of 23% over the previous three years, with:
- zinc ore, down $98m (53%) with volumes down 57% and prices up 9%
- copper ore, down $97m (24%) with volumes down 13% and prices down 12%
- alumina, down $68m (13%) with volumes down 8% and prices down 6%.
Other goods
The trend estimate of other goods exports rose $41m (3%) to $1,216m.
In seasonally adjusted terms, exports of other goods rose $301m (28%) to $1,363m, driven by non-monetary gold, up $316m (36%).
In original terms, exports of other goods rose $303m (29%) to $1,357m.
Exports of Services
SERVICES CREDITS
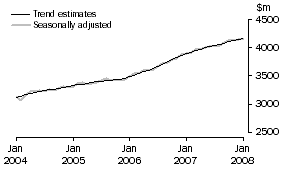
In trend terms, services credits rose $13m to $4,152m.
Seasonally adjusted, services credits rose $1m to $4,144m.
The components contributing to the rise in the seasonally adjusted estimates were:
- other services, up $14m (1%)
- transportation services, up $6m (1%).
Largely offsetting these effects was the travel services component, down $20m (1%).
Seasonally adjusted, tourism related services credits fell $27m (1%) to $2,597m. This series is seasonally adjusted independently to the series that comprise services credits.
IMPORTS OF GOODS AND SERVICES
The trend estimate of goods and services debits rose $285m (1%) between December 2007 and January 2008 to $21,177m.
In seasonally adjusted terms, goods and services debits rose $1,106m (5%) to $21,742m. Intermediate and other merchandise goods rose $582m (8%), other goods rose $402m (83%) and consumption goods rose $144m (3%) while capital goods fell $105m (3%). Services debits rose $82m (2%).
Imports of goods
GOODS DEBITS
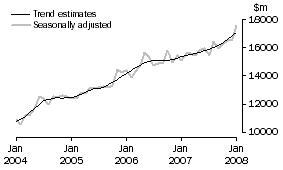
CONSUMPTION GOODS
The trend estimate of imports of consumption goods rose $69m (1%) to $5,062m.
In seasonally adjusted terms, imports of consumption goods rose $144m (3%) to $5,143m.
The main components contributing to the rise in the seasonally adjusted estimates were:
- non-industrial transport equipment, up $93m (6%)
- food and beverages, mainly for consumption, up $33m (5%).
Partly offsetting these effects were:
- textiles, clothing and footwear, down $8m (1%)
- consumption goods n.e.s., down $5m.
In original terms, imports of consumption goods rose $110m (2%) to $4,859m.
CAPITAL GOODS
The trend estimate of imports of capital goods rose $42m (1%) to $3,767m.
In seasonally adjusted terms, imports of capital goods fell $105m (3%) to $3,725m.
The main component contributing to the fall in the seasonally adjusted estimates was civil aircraft, down $258m.
Partly offsetting this effect were:
- machinery and industrial equipment, up $113m (9%)
- industrial transport equipment n.e.s., up $39m (6%).
In original terms, imports of capital goods fell $293m (8%) to $3,481m.
INTERMEDIATE AND OTHER MERCHANDISE GOODS
The trend estimate of imports of intermediate and other merchandise goods rose $129m (2%) to $7,519m.
In seasonally adjusted terms, imports of intermediate and other merchandise goods rose $582m (8%) to $7,826m.
The main components contributing to the rise in the seasonally adjusted estimates were:
- fuels and lubricants, up $372m (16%)
- organic and inorganic chemicals, up $97m (31%)
- processed industrial supplies n.e.s., up $53m (3%)
- other merchandise goods, up $31m (29%)
- iron and steel, up $31m (11%).
Partly offsetting these effects were:
- other parts for capital goods, down $15m (2%)
- paper and paperboard, down $13m (7%).
In original terms, imports of intermediate and other merchandise goods rose $1,033m (15%) to $7,874m.
OTHER GOODS
The trend estimate of imports of other goods rose $6m (1%) to $705m.
In both original and seasonally adjusted terms, other goods debits rose $402m (83%) to $887m, driven by non-monetary gold, up $410m (120%).
Imports of services
SERVICES DEBITS
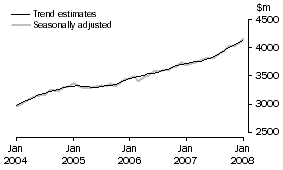
In trend terms, services debits rose $39m (1%) to $4,124m.
Seasonally adjusted, services debits rose $82m (2%) to $4,161m.
All components contributed to the rise in the seasonally adjusted estimates with:
- transportation services, up $52m (4%)
- travel services, up $30m (2%)
- other services, up $1m.
Seasonally adjusted, tourism related services debits rose $19m (1%) to $2,158m. This series is seasonally adjusted independently to the series that comprise services debits.
 Print Page
 Print All