GRAPHS
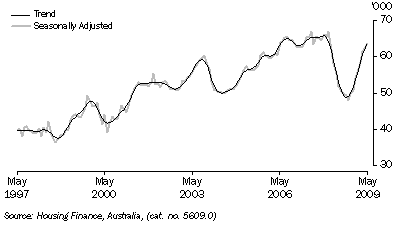
Secured housing finance commitments to individuals, (from Table 8.2)
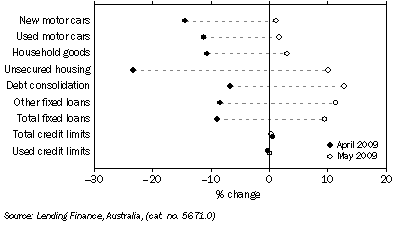
Personal finance commitments, (from Table 8.3) Change from previous month
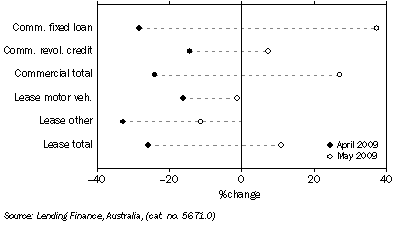
Commercial and lease finance commitments, (from Table 8.4) Change from previous month
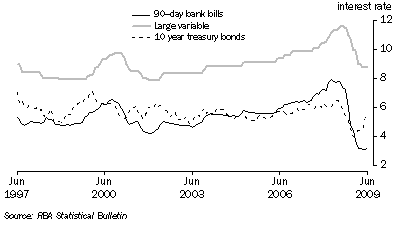
Key interest rates, (from Table 8.5)
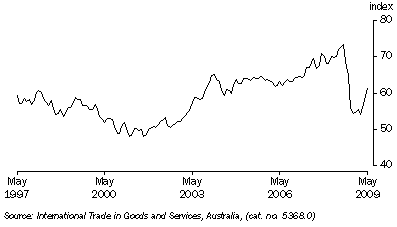
Trade weighted index, (from Table 8.6)
- May 1970 = 100.0
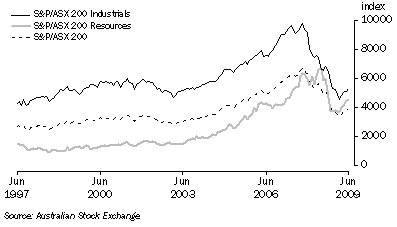
Australian stock market indexes, (from Table 8.7)
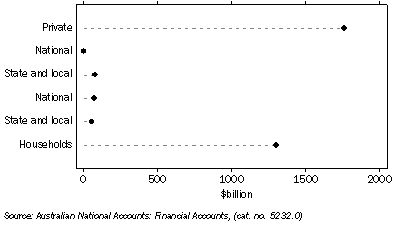
Credit market outstanding, (from Table 8.8) Non-financial domestic sector
- March Quarter 2009
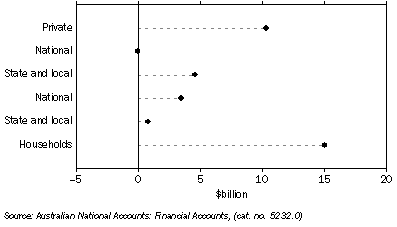
Demand for credit by, (from Table 8.8) Non-financial domestic sector
- March Quarter 2009
 Print Page
 Print Page