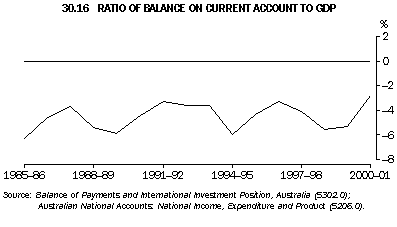
Table 30.15 and graph 30.16 show that the ratio of the current account deficit to GDP was 2.8% in 2000-01, down significantly on the previous year, and well below the average for the last ten years (4.2%).
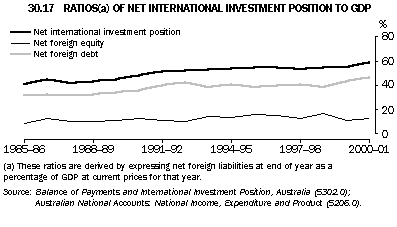
Graph 30.17 shows that the ratio of Australia's net foreign liabilities (Australia's net international investment position) to GDP has been rising for most years since 30 June 1988 and reached its highest level of nearly 59% at 30 June 2001. The ratio of net foreign debt to GDP was 46.4% at 30 June 2001, up strongly on the results for recent years. The ratio of net foreign equity to GDP was 12.4% at 30 June 2001, up on the ratio at 30 June 2000, but still below the average for the last ten years (13.4%).
Table 30.15 shows that the net investment income payable on net foreign debt as a percentage of goods and services credits was 9.2% in 2000-01, down on the previous year. The ratio of net investment income payable on equity to goods and services credits was 3.5% in 2000-01, down significantly on the ratio for the previous five years.
30.15 RATIOS |
|
| | 1995-96 | 1996-97 | 1997-98 | 1998-99 | 1999-2000 | 2000-01 |
|
$ MILLION |
|
| GDP(a) | 502,828 | 529,886 | 561,228 | 591,592 | 629,212 | 670,029 |
|
RATIOS TO GDP (%) |
|
| Current account | -4.3 | -3.3 | -4.1 | -5.6 | -5.3 | -2.8 |
| Goods and services | -0.4 | 0.3 | -0.8 | -2.4 | -2.3 | 0.1 |
| - Credits | 19.7 | 19.8 | 20.3 | 18.9 | 20.0 | 22.9 |
| - Debits | -20.1 | -19.5 | -21.1 | -21.4 | -22.3 | -22.7 |
| Income | -3.9 | -3.6 | -3.2 | -3.1 | -3.1 | -2.9 |
| Net international investment position(b) | 54.8 | 54.8 | 52.9 | 55.0 | 54.4 | 58.8 |
| - Net foreign equity | 16.2 | 15.4 | 12.3 | 16.9 | 11.1 | 12.4 |
| - Net foreign debt | 38.6 | 39.4 | 40.6 | 38.1 | 43.2 | 46.4 |
|
RATIOS TO GOODS AND SERVICES CREDITS (%) |
|
| Net investment income | -19.9 | -18.3 | -15.9 | -16.2 | -15.2 | -12.7 |
| - Net foreign equity | -8.4 | -7.1 | -6.2 | -7.0 | -5.1 | -3.5 |
| - Net foreign debt | -11.5 | -11.2 | -9.7 | -9.2 | -10.2 | -9.2 |
|
(a) GDP at current prices.
(b) These ratios are derived by expressing net foreign liabilities at end of year as a percentage of GDP at current prices for that year. |
Source: Balance of Payments and International Investment Position, Australia (5302.0); Australian National Accounts: National Income, Expenditure and Product (5206.0). |


 Print Page
 Print Page