NOTES
INTRODUCTION
This publication presents results from an Australian Bureau of Statistics (ABS) survey of businesses engaged in pubs, taverns, bars and hospitality club services. The survey was conducted in respect of the 2004-05 financial year. This is the sixth survey of pubs, taverns, bars and hospitality club services. Previous collections were conducted in respect of the 1986-87, 1991-92, 1994-95, 1997-98 and 2000-01 financial years.
COMPARISONS WITH PREVIOUS SURVEY RESULTS
While comparisons are made between the 2004-05 and 2000-01 survey results, it should be noted that the 2004-05 survey was not designed to provide highly accurate estimates of change, so any comparison made to the previous survey should be used with caution. For further information, see paragraphs 19-21 of the Explanatory Notes.
MORE INFORMATION ON ABS SERVICE INDUSTRIES STATISTICS
Information about ABS activities in the field of service industries is available from the Service Industries Statistics theme page on the ABS web site <https://www.abs.gov.au>. To access the theme page, select 'Themes' from the menu on the home page.
COMMENTS
The ABS welcomes comments and suggestions from users regarding future surveys of Service Industries. These comments should be addressed to the Director, Service Industries National Statistics Centre, Australian Bureau of Statistics, Locked Bag 10, Belconnen, ACT 2616.
ROUNDING
Where figures have been rounded, discrepancies may occur between the sum of the component items and the total.
INQUIRIES
For further information about these and related statistics, contact the National Information and Referral Service on 1300 135 070 or Sophie Vassiliou on Melbourne (03) 9615 7442.
SUMMARY COMMENTARY
CHAPTER 1 PUBS, TAVERNS AND BARS
INTRODUCTION
This chapter presents results of the 2004-05 Pubs, Taverns and Bars Survey. This survey is conducted periodically by the ABS to provide detailed measures of the performance, structure and activity of pub, tavern and bar businesses operating in Australia. It includes aspects such as: the composition of income earned, details of expenses incurred and the characteristics of the workforce. A state/territory dimension is also presented.
The survey scope included significant employing and non-employing businesses in Australia that generated income predominantly from the provision of alcoholic beverages for consumption on the premises, or in selling alcoholic beverages for consumption on and/or off the premises (e.g. from bottle shops at such premises). Businesses mainly engaged in the provision of accommodation, retailing alcoholic beverages for consumption only off the premises, or organisations mainly engaged in operating licensed clubs were excluded from this survey. Organisations mainly engaged in operating licensed hospitality clubs were included in a separate survey, for which results are presented in Chapter 2 of this publication.
This chapter presents data dissected by businesses with gambling facilities and businesses without gambling facilities. Businesses with gambling facilities are those providing either poker/gaming machines, Totalizator Agency Board (TAB) facilities and/or Keno services to patrons.
SUMMARY OF FINDINGS
At the end of June 2005, there were 3,454 pub, tavern and bar businesses operating in Australia. The total number of premises (4,252) were split almost evenly between capital cities and suburbs (2,108) and non-metropolitan areas (2,144).
During 2004-05, income generated by pub, tavern and bar businesses was $11,114.3m, which represented an average of $3.2m per business. Total expenses incurred for the same period were $10,369.5m.
In 2004-05, pub, tavern and bar businesses provided 194,769 paid live performances.
The total industry value added by these businesses was $4,394m, which is the equivalent of 0.5% of Australia's gross domestic product (GDP) for 2004-05.
For 2004-05, pub, tavern and bar businesses recorded an operating profit before tax of $784.2m, which represented an operating profit margin of 7.1%.
SOURCES OF INCOME
ALL BUSINESSES
During 2004-05, pub, tavern and bar businesses generated a total of $11,114.3m in income. It should be noted that income in 2004-05 excluded goods and services tax (GST) paid by consumers to pub, tavern and bar businesses.
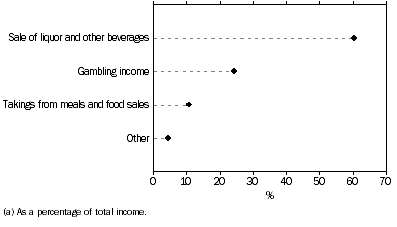
The graph below shows that the main source of income was from sales of liquor and other beverages which generated $6,706.1m (60.3% of total income). Other major income items were gambling income, which accounted for 24.3% ($2,703.1m) of all income, and takings from meals and food sales, which accounted for 10.8% ($1,200.6m).
SELECTED SOURCES OF INCOME(a), All businesses
Of the income from the sale of liquor and other beverages, 53.7% was for consumption on the premises, while the remainder was for consumption off the premises.
BUSINESSES WITH GAMBLING FACILITIES
The total income of businesses with gambling facilities was $9,565.1m which represented 86.1% of total income for all businesses. The major sources of income for businesses with gambling facilities were the sale of liquor and other beverages of $5,511.6m (57.6%) and gambling income of $2,703.1m (28.3%).
The gambling income of these businesses was sourced primarily from poker/gaming machines (96.7%), with the remainder generated from TAB commissions (2.7%) and Keno commissions (0.6%).
BUSINESSES WITHOUT GAMBLING FACILITIES
The total income for pub, tavern and bar businesses without gambling facilities was $1,549.2m in 2004-05. The major sources of income for these businesses were sales of liquor and other beverages of $1,194.6m (77.1% of total income) and takings from meals and food sales of $233.4m (15.1% of total income).
EXPENDITURE
ALL BUSINESSES
Pub, tavern and bar businesses incurred $10,369.5m in expenses during 2004-05. Overall, purchases of liquor and other beverages was the highest single expense item, accounting for 36.7% ($3,806.5m) of total expenses, followed by labour costs (21.9% or $2,268m) and gambling taxes and levies (9.1% or $940.5m). Labour costs represented an average cost per employee of $28,100.
Other major expenses for pub, tavern and bar businesses in 2004-05 were rent, leasing and hiring ($641m), purchases of foodstuffs for preparing meals ($546.5m), interest expenses ($273.5m), depreciation and amortisation ($227.9m) and advertising, marketing and promotion expenses ($199.5m).
BUSINESSES WITH GAMBLING FACILITIES
In 2004-05, pub, tavern and bar businesses with gambling facilities recorded total expenses of $8,901.5m. The largest expense items incurred by these businesses were purchases of liquor and other beverages ($3,317.4m) and labour costs ($1,891.4m).
BUSINESSES WITHOUT GAMBLING FACILITIES
Businesses without gambling facilities incurred expenses totalling $1,468.0m in 2004-05. Purchases of liquor and other beverages ($489.1m) contributed 33.3% and labour costs ($376.6m) contributed 25.7% of total expenses for these businesses.
EMPLOYMENT
ALL BUSINESSES
At the end of June 2005, there were 81,675 persons employed in pub, tavern and bar services. Of these, 57,262 persons (70.1%) were casual employees and 43,179 (52.9%) were female employees. Employment also included 18,779 permanent full-time employees and 4,574 part-time employees.
BUSINESSES WITH GAMBLING FACILITIES
Businesses with gambling facilities recorded employment of 64,905 persons, which accounted for 79.5% of total employment in pub, tavern and bar businesses. These businesses had 21,924 staff who were trained as licensed gaming staff (33.8% of total employment for businesses with gambling facilities).
BUSINESSES WITHOUT GAMBLING FACILITIES
Businesses without gambling facilities recorded employment of 16,770 persons, which accounted for 20.5% of total employment in pub, tavern and bar businesses.
SIZE OF BUSINESSES
ALL BUSINESSES
The majority (65.1% or 2,247) of pub, tavern and bar businesses employed fewer than 20 persons. These small businesses accounted for 26.9% of total employment in pub, tavern and bar services, 28.4% of income from sales of liquor and other beverages, 28.2% of gambling income and 27.9% of total income.
KEY CHARACTERISTICS BY BUSINESS SIZE(a), All businesses
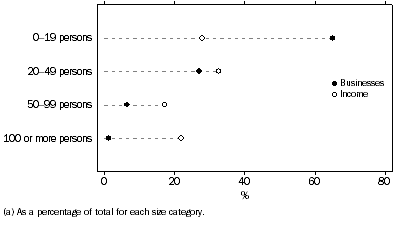
In comparison, only 46 pub, tavern and bar businesses (1.3% of total businesses) recorded employment of 100 or more persons. These large businesses accounted for 20.5% of employment in pub, tavern and bar services, 22.9% of income from sales of liquor and other beverages, 20.5% of gambling income and 22% of total income.
BUSINESSES WITH GAMBLING FACILITIES
There were 2,362 pub, tavern and bar businesses with gambling facilities at the end of June 2005 of which 1,401 (59.3%) had less than 20 persons employed. These businesses accounted for 22.3% of total employment, 24.5% of sales from liquor and other beverages and 24.9% of total income.
BUSINESSES WITHOUT GAMBLING FACILITIES
There were 1,092 pub, tavern and bar businesses without gambling facilities at the end of June 2005, of which 846 (77.5%) had less than 20 persons employed. These businesses accounted for 44.4% of total employment, 46.7% of sales from liquor and other beverages and 46.7% of total income.
STATES AND TERRITORIES
ALL BUSINESSES
The following graph shows that New South Wales accounted for the highest share of key business activity - business counts, income and employment.
STATE AND TERRITORY COMPARISONS(a), All businesses
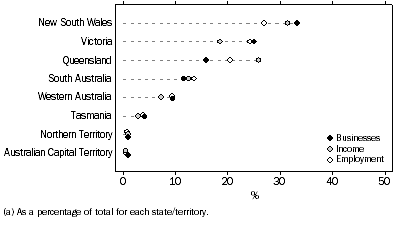
New South Wales accounted for just over one-third of all pub, tavern and bar businesses (33.3%), while Victoria accounted for 25.1% and Queensland 15.9%. New South Wales accounted for 31.5% of all income, while Queensland accounted for 25.9% and Victoria 18.5%.
Employment in New South Wales comprised 27% of all employment, while Victoria had just under one-quarter (24.3%). Queensland had 20.5% of all employment.
HISTORICAL COMPARISONS
Comparisons with results from earlier surveys are useful as an indication of the extent of change over time. However, the survey was not designed to provide highly accurate estimates of change, so any comparisons with results from previous surveys should be made with caution. Estimates of change can be subject to changes in scope and coverage or question wording, or high levels of sampling error. Further information can be found in paragraphs 19-21 of the Explanatory Notes.
Taking into consideration these limitations, the 2004-05 survey results indicate that pub, tavern and bar businesses experienced growth between 2000-01 and 2004-05 financial years. Income grew by an average 5.8% per year since 2000-01 while expenditure grew at the rate of 6% per year for the same period. The operating profit before tax grew at an average annual rate of 2.3% per year (from $715.2m in 2000-01 to $784.2m in 2004-05).
CHAPTER 2 CLUBS (HOSPITALITY)
INTRODUCTION
This chapter presents results of the 2004-05 Clubs (Hospitality) Survey. This survey is conducted periodically by the ABS to provide detailed measures of the performance, structure and activity of hospitality club organisations operating in Australia. It includes aspects such as: the composition of income earned, details of expenses incurred and the characteristics of the workforce. A state/territory dimension is also presented.
The survey scope included significant employing and non-employing organisations in Australia that generated income predominantly from the provision of hospitality services (drinking facilities, gambling, meals and other hospitality services) to members. As such, clubs whose main activity was the provision of sporting services were not included within the scope of this industry.
As gambling services are an important aspect of hospitality clubs, this chapter presents data dissected by clubs with gambling facilities and clubs without gambling facilities. Clubs with gambling facilities are those providing either poker/gaming machines, TAB facilities and/or Keno services to patrons.
SUMMARY OF FINDINGS
At the end of June 2005, there were 2,116 hospitality clubs operating in Australia. Of the 2,310 premises, 995 (43.1%) were located in capital cities and suburbs and 1,315 (56.9%) were located in non-metropolitan areas. The 2,116 organisations comprised 1,816 clubs with gambling facilities and 300 clubs without gambling facilities.
During 2004-05, income generated by hospitality clubs was $7,374.7m which represented an average of $3.5m per organisation. Total expenses incurred for the same period were $6,763.9m.
In 2004-05, hospitality clubs provided 114,082 paid live performances.
The total industry value added by these organisations was $4,086.1m, which is the equivalent of 0.5% of Australia's GDP for 2004-05.
Hospitality clubs in Australia recorded an operating profit/surplus before tax of $612.7m, which represented an operating profit/surplus margin of 8.4%.
SOURCES OF INCOME
ALL ORGANISATIONS
The total income of hospitality clubs in Australia was $7,374.7m in 2004-05. It should be noted that income in 2004-05 excluded GST paid by consumers to hospitality clubs.
The graph below shows that the main source of income for hospitality clubs was from gambling ($4,305.1m or 58.4% of total income). Other major income items were sales of liquor and other beverages, which accounted for 21.7% ($1,600.8m) of total income, and takings from sales of meals and food, which accounted for 9.9% ($726.4m).
SELECTED SOURCES OF INCOME(a), All organisations
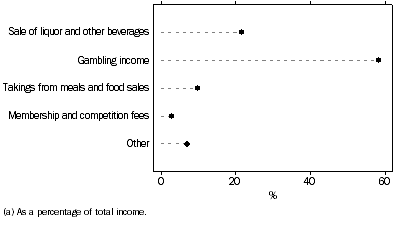
Other major sources of income included membership fees ($210.4m), casual playing fees ($82.7m), sponsorship and fundraising ($80.2m), rent, leasing and hiring ($58.1m) and interest income ($44.7m).
ORGANISATIONS WITH GAMBLING FACILITIES
In 2004-05, the total income of hospitality clubs with gambling facilities was $7,103m. Gambling income accounted for 60.6% of the total income for these organisations. Nearly all the gambling income was generated by poker/gaming machines ($4,221.8m or 98.1%), with the remainder of gambling income received as commissions for the provision of Keno and TAB facilities (1.4% and 0.6% respectively). Other important sources of income for hospitality clubs with gambling facilities included sales of liquor and other beverages ($1,503.6m) and takings from meals and food ($664.9m).
ORGANISATIONS WITHOUT GAMBLING FACILITIES
The total income for hospitality clubs without gambling facilities was $271.8m during 2004-05. Income from sales of liquor and other beverages ($97.2m), takings from sales of meals and food ($61.5m) and income from membership fees ($60.6m) were the main sources of income for these organisations.
EXPENDITURE
ALL ORGANISATIONS
Hospitality clubs incurred $6,763.9m in expenses during 2004-05. Labour costs represented the largest single expense item ($2,121.6m or 31.4% of total expenses) which represented an average cost per employee of $33,300.
Other major expense items were poker/gaming machine and other gambling taxes and levies ($1,104m), purchases of liquor and other beverages ($731.2m), depreciation and amortisation ($548.9m), purchases of foodstuffs used in preparing meals ($329.4m), advertising, marketing and promotional expenses ($285.3m) and repair and maintenance expenses ($203.3m).
ORGANISATIONS WITH GAMBLING FACILITIES
The total expenses of hospitality clubs with gambling facilities were $6,497.1m in 2004-05. The main expense item for these organisations was labour costs ($2,022.6m), poker/gaming machine and other gambling taxes and levies ($1,104m) and purchases of liquor and other beverages ($685.9m).
ORGANISATIONS WITHOUT GAMBLING FACILITIES
The total expenses of hospitality clubs without gambling facilities were $266.9m. The main contributors to total expenses incurred by these organisations in 2004-05 were labour costs ($98.9m), purchases of liquor and other beverages ($45.4m) and purchases of foodstuffs used in preparing meals ($26.6m).
EMPLOYMENT
ALL ORGANISATIONS
At the end of June 2005, there were 63,734 persons employed in hospitality clubs. Of the total employment, 30,897 persons (48.5%) were casual employees, 21,060 persons (33%) were permanent full-time employees and 11,777 persons (18.5%) were employed in a permanent part-time capacity. Female employees accounted for 54.8% of total employees, 39.9% of permanent full-time employees, 65.8% of permanent part-time employees and 60.8% of casuals.
ORGANISATIONS WITH GAMBLING FACILITIES
The total number of employees in clubs with gambling facilities was 60,200 persons or 94.5% of total employment in all hospitality clubs. Clubs with gambling facilities had 19,798 persons employed in a permanent full-time capacity, 11,586 persons employed on a permanent part-time basis and 28,815 persons employed on a casual basis. Of the total number of employees, 23,813 (37.4%) were licensed gaming staff.
ORGANISATIONS WITHOUT GAMBLING FACILITIES
In comparison, there were 3,534 persons employed in clubs without gambling facilities in 2004-05. Over one-third of all persons employed were female casual employees who accounted for 36.8% of the total employment in these organisations.
SIZE OF ORGANISATIONS
ALL ORGANISATIONS
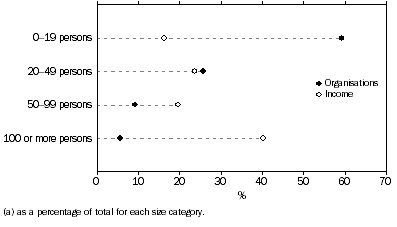
The majority (59.2% or 1,252) of hospitality club organisations employed fewer than 20 persons. These small organisations accounted for 18.7% of total employment in hospitality club services, 30.6% of income from sales of liquor and other beverages, 10.9% of gambling income and 16.3% of total income.
In comparison, there were 120 organisations which recorded employment of 100 or more persons. These large organisations accounted for 34.4% of total employment in hospitality clubs, 24.3% of income generated from sales of liquor and other beverages, 47.3% of gambling income and 40.2% of total income.
KEY CHARACTERISTICS BY ORGANISATION SIZE(a), All organisations
STATES AND TERRITORIES
ALL ORGANISATIONS
The following graph shows that New South Wales accounted for the highest share of key business activity - business counts, income and employment.
STATE AND TERRITORY COMPARISONS(a), All organisations
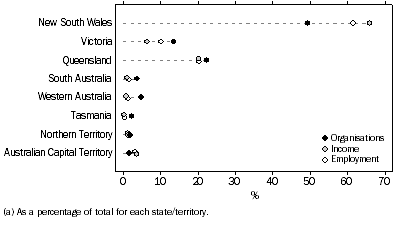
New South Wales accounted for just under half of all hospitality clubs (49.4%), while Queensland accounted for 22.4% and Victoria accounted for 13.5%. New South Wales accounted for two-thirds of all income (65.9%), while Queensland accounted for 20.3% and Victoria 6.5%.
Employment in New South Wales comprised 61.5% of all employment, while Queensland had 20.4% of all employment. Victoria had 10.2% of all employment.
HISTORICAL COMPARISONS
Comparisons with results from earlier surveys are useful as an indication of the extent of change over time. However, the survey was not designed to provide highly accurate estimates of change, so any comparisons with results from previous surveys should be made with caution. Estimates of change can be subject to changes in scope and coverage or question wording, or high levels of sampling error. Further information can be found in paragraphs 19-21 of the Explanatory Notes.
Taking into consideration these limitations, the 2004-05 survey results indicate that hospitality club organisations experienced growth between 2000-01 and 2004-05 financial years. Income grew by an average 5.1% per year since 2000-01 while expenditure grew at the rate of 4.5% per year for the same period. Operating profit before tax grew at an average annual rate of 13.3% per year (from $372.1m in 2000-01 to $612.7m in 2004-05).
 Print Page
 Print All