FEATURE ARTICLE: FIRST HOME BUYERS IN AUSTRALIA
INTRODUCTION
Home ownership is a widely held aspiration in Australia, providing security of tenure and long-term economic benefits to home owners. Housing is also very significant in the national economy in terms of investment levels, building activity and employment.
Australia has one of the highest levels of home ownership in the world. Results from the Census of Population and Housing show that home ownership was at 70% in 2006, little changed over the past 40 years (see table 1). Small fluctuations in measured home ownership rates derived from census data in part reflect methodological differences from Census to Census.
1. ALL OCCUPIED PRIVATE DWELLINGS, By tenure type |
|
 | Owner without a mortgage | Owner with a mortgage | All owner occupied private dwellings | Renter | Other Tenure | Total(a) | Proportion of owner occupied private dwellings |
| Year | `000 | `000 | `000 | `000 | `000 | `000 | % |
|
| 1966(b) | na | na | 2 232 | 835 | 60 | 3 127 | 71.4 |
| 1971(b) | na | na | 2 469 | 1 001 | 119 | 3 589 | (c)68.8 |
| 1976 | 1 306 | 1 438 | (d)2 762 | 1 045 | 232 | 4 039 | (e)68.4 |
| 1981 | 1 549 | 1 543 | (d)3 179 | 1 164 | 191 | 4 534 | 70.1 |
| 1986 | 1 982 | 1 604 | 3 586 | 1 334 | 174 | 5 095 | 70.4 |
| 1991 | 2 362 | 1 561 | 3 923 | 1 561 | 210 | 5 694 | 68.9 |
| 1996 | 2 658 | (f)1 656 | 4 314 | 1 866 | 68 | 6 248 | 69.0 |
| 2001 | 2 811 | (f)1 872 | 4 683 | 1 953 | 101 | 6 737 | 69.5 |
| 2006 | 2 478 | (f)2 448 | 4 926 | 2 064 | 66 | 7 056 | 69.8 |
|
| na not available |
| (a) Excludes not stated. |
| (b) Separate figures for owners without a mortgage and owners with a mortgage are not available for these years. |
| (c) Following the 1967 Referendum and a subsequent change in the Indigenous question wording in the Census in 1971, the Indigenous census count increased 45%. This change made a small contribution to the decrease in the measured proportion of owner occupied private dwellings. |
| (d) Includes 'owner/purchaser undefined' which account for 0.4% of the total in 1976 and 1.9% in 1981. In subsequent years only the specific categories of 'owner with a mortgage' and 'owner without a mortgage' were included on Census forms, which may have resulted in some decline in measured ownership rates. |
| (e) Due to budgetary restraints, the ABS was unable to complete the normal processing of the data and a 50% sample was processed. The impact of this on the measured proportion of owner occupied private dwellings is not clear. |
| (f) Includes dwellings 'Being purchased under a rent/buy scheme'. These accounted for 0.5% of occupied private dwellings in 1996, 0.7% in 2001 and 0.2% in 2006. Note that in the 2007-08 SIH this tenure type had fallen to 0.04%. In previous years this tenure category was not separately catered for on Census forms and it is not known how households with rent/buy tenure would have responded to the questions on tenure. |
| Source: ABS data available on request, Census of Population and Housing. |
While at any one time most people in Australia are living in owner occupied dwellings, many factors influence when and if people enter the housing market for the first time i.e. become first home buyers. For many, the decision to become a first home buyer (FHB) will reflect their life cycle stage (partnering, having children) and their capacity to finance the purchase of a dwelling and service that financial commitment. For some people, acquisition of other assets may take precedence over housing.
This article examines the characteristics of FHBs and how they have changed since the mid 1990s.
HOUSING FINANCE
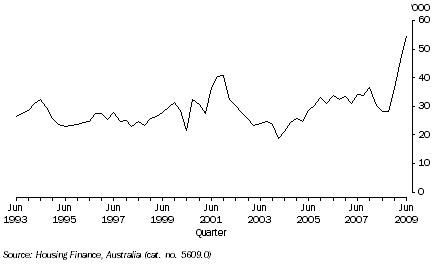
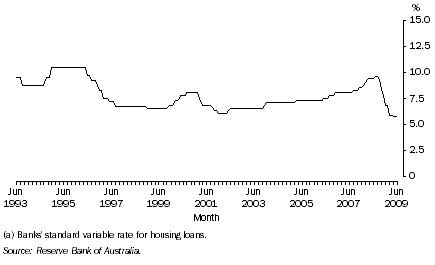
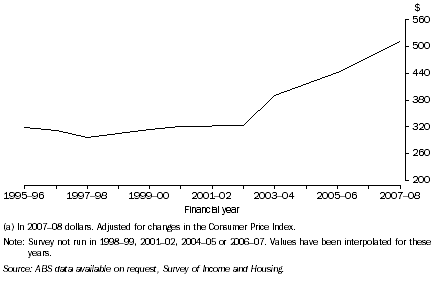
During the year to June 2009, there were 165,000 housing finance commitments to first home buyers, the highest annual rate since data collection began in July 1991 (see graph 2). Over this period the banks' standard variable interest rate for housing loans fell steadily from 9.6% to 5.75% (see graph 3) and the First Home Owners Boost (FHOB) was introduced to provide additional incentives for people to enter the housing market. The historical low interest rates and the limited duration of the FHOB are likely to have brought forward some FHB decisions into this period.
2. FHB finance commitments
3. Home loan interest rates, Standard variable rate (a)
FHB WITHOUT A MORTGAGE
In the ABS Survey of Income and Housing (SIH), a FHB is defined as a household in which the reference person for that household (or their co-resident partner) bought the dwelling in which they reside in the three years prior to being interviewed, and neither that reference person nor their co-resident partner had owned a home previously.
In the 2007-08 SIH, 318,000 Australian households had purchased their first home in the 3 years prior to interview, the same number as in 2005-06. Of these, 92% owned their home with a mortgage at the time of interview, down from 95% in the two previous surveys (see table 4).
4. FHB Households with and without a mortgage |
|
| FHBs without a mortgage | FHBS with a mortgage | All FHB households | Proportion of FHBs with a mortgage |
| '000 | '000 | '000 | % |
|
| 1995-96 | 68.6 | 318.2 | 386.8 | 82.3 |
| 1996-97 | 45.6 | 329.9 | 375.5 | 87.9 |
| 1997-98 | 58.8 | 387.1 | 445.9 | 86.8 |
| 1999-00 | 65.9 | 328.3 | 394.2 | 83.3 |
| 2000-01 | 55.0 | 358.2 | 413.2 | 86.7 |
| 2002-03 | 38.6 | 384.2 | 422.8 | 90.9 |
| 2003-04 | 21.2 | 372.8 | 394.0 | 94.6 |
| 2005-06 | *14.6 | 303.3 | 317.8 | 95.4 |
| 2007-08 | *25.6 | 292.2 | 317.8 | 91.9 |
|
| * estimate has a relative standard error of 25% to 50% and should be used with caution |
| Source: ABS data available on request, Survey of Income and Housing. |
| Note: Survey not run in 1998-99, 2001-02, 2004-05 or 2006-07. |
FHB WITH A MORTGAGE
The remainder of this article focuses on FHBs with a mortgage. Most of the data referred to is included in tables 16 to 18 at the end of this article.
Most FHBs with a mortgage in 2007-08 were relatively young, with 67% having the reference person aged under 35 years. Only 7% of FHBs with a mortgage had the reference person aged 45 years or older. Between 1995-96 and 2007-08 the average age of the reference person remained between 31 and 33 years. The age distribution of the reference person in these households has changed little over this period.
Partnering often precedes home purchase, and often has the advantage of providing two incomes to meet the associated housing costs, particularly during the initial loan repayment period. Couple households made up the majority (65%) of FHBs with a mortgage in 2007-08, with just under half of these including children. A further 22% were lone person households. There has been little change in the family composition of FHBs with a mortgage since 1995-96.
In 2007-08, the majority (58%) of FHBs with a mortgage had at least two income earners, a proportion that has remained broadly unchanged since 1995-96. All but 3% of these households had someone in full or part-time employment at the time of the survey.
Nearly three quarters (74%) of reference people in FHB households with a mortgage had a non-school qualification in 2007-08, up from 58% in 1995-96. In 2007-08, 40% had a bachelor degree or higher, compared with 18% in 1995-96 and 33% in 2005-06.
In 2007-08, educational attainment was a little lower in the general population in the age group 18-44 years (a reasonable approximation to the FHB age group). In this population 66% had a non-school qualification, compared to 74% for FHBs with a mortgage.
HOME PURCHASES
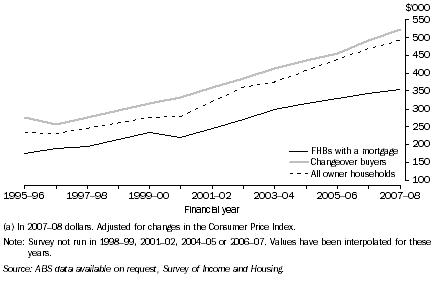
On average, FHBs with a mortgage purchase less expensive homes than changeover buyers i.e. households that had previously owned another dwelling. In 2007-08 the mean value of the dwelling of FHBs with a mortgage (as estimated by the householder) was $356,000, compared to $522,000 for changeover buyers and $493,000 for all owner households (see graph 5).
Between 1995-96 and 2007-08 the mean value of dwellings, estimated by their owners at the time of interview, was consistently substantially lower for FHBs with a mortgage than for changeover buyers. After adjustment for inflation, the mean value of dwellings for FHBs with a mortgage increased by 102% over this period (from $176,000 to $356,000), compared with 90% increase for changeover buyers (from $275,000 to $522,000).
5. Mean estimated value of dwelling (a), By owner type
Dwelling type
Although separate houses have continued to be the most favoured form of housing in Australia, there has been a shift among FHBs with a mortgage towards medium and high density housing (which includes semi-detached houses, terrace houses, townhouses, flats, units and apartments). In 2007-08, 29% of FHBs with a mortgage occupied these types of dwellings, up from 15% in 1995-96.
In 2007-08, FHBs with a mortgage lived in smaller dwellings, on average (2.8 bedrooms), than either changeover buyers (3.2 bedrooms) or all owner households (3.2 bedrooms). This, along with the differences in house prices, indicates that FHBs with a mortgage occupy different segments of the housing market compared to changeover buyers.
Consistent with the FHB trend towards medium and higher density housing, the average number of bedrooms for dwellings occupied by FHBs with a mortgage has decreased from 2.95 in recent surveys to 2.80 in 2007-08.
FHBs with a mortgage are less likely to purchase new homes now than they were in 1995-96. Over this period, the proportion of FHBs with a mortgage buying new homes, as opposed to established homes, declined from 23% to 9%. The shift away from new dwellings and separate houses towards established dwellings and higher density housing may reflect the availability of housing stock as well as changing lifestyle and locational preferences among first home buyers with a mortgage.
Housing loans
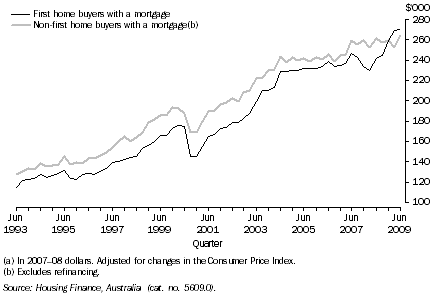
Traditionally FHBs have borrowed less money, on average, than non-first home buyers. However from late 2008 the average loan amount of FHBs with a mortgage was higher than the average amount borrowed by non-first home buyers with a mortgage (see graph 6). In June 2009 the average amount borrowed by FHBs with a mortgage was $270,000 (in 2007-08 dollars), while the average amount borrowed by non-first home buyers with a mortgage was $264,000.
In real terms, the average size of loans taken out by FHBs with a mortgage rose by $156,000 (or 136%) since June 1993, mainly reflecting the rise in dwelling values over this period.
6. Average loan size (a), Purchase of owner occupied dwellings with a mortgage
Monetary assistance and deposits
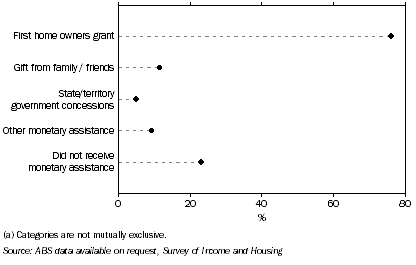
The majority of FHBs with a mortgage received monetary assistance to purchase their dwelling. Over three-quarters (76%) of FHBs with a mortgage reported receiving the First Home Owners Grant. The next largest source of monetary assistance was gifts from family and friends (12%). Nearly a quarter (23%) of FHBs received no monetary assistance (see graph 7).
7. All sources of monetary assistance(a), FHBs with a mortgage
- 2007-08
For most FHBs, purchasing a home involves raising a deposit to secure a housing loan. In 2007-08 86% of FHBs with a mortgage had a deposit to purchase their dwelling. The Northern Territory and Victoria reported the highest proportion of FHBs with a mortgage that had a deposit (100% and 96% respectively).
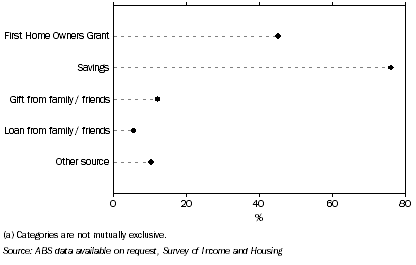
In 2007-08, the most common sources of the deposit were savings (76%) and the First Home Owners Grant (45%) (see graph 8).
8. All sources of funds for home deposit(a), FHBs with a mortgage
- 2007-08
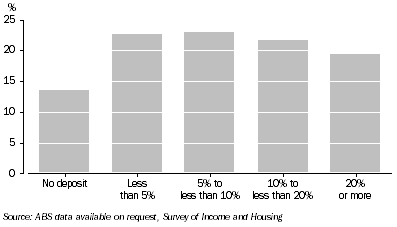
As a proportion of the purchase price of their dwelling, over half (59%) of the FHBs with a mortgage had less than a ten percent deposit or no deposit. A further 22% reported having a deposit of between 10% and 20% of the purchase price of their dwelling, while 19% had a deposit of 20% or more.
9. Proportion of FHBs with a mortgage by size of deposit, 2007-08
While the average deposit in 2007-08 was $45,000 (for those households who had a deposit), there were clear differences at the state and territory level. The average deposits in New South Wales ($61,000) and the ACT ($48,000) were substantially larger than in South Australia ($27,000) or Tasmania ($16,000). While some of these differences reflect variations in property prices between states and territories, as a proportion of the average purchase price of the dwelling, the deposits were still larger in New South Wales (17%) and the ACT (13%) than in South Australia (11%) and Tasmania (8%).
HOUSEHOLD ECONOMIC RESOURCES
The capacity of a household to purchase a home and to service the ongoing costs of a home loan, together with other household costs, is largely determined by its access to economic resources, notably the incomes and wealth of its members.
Income
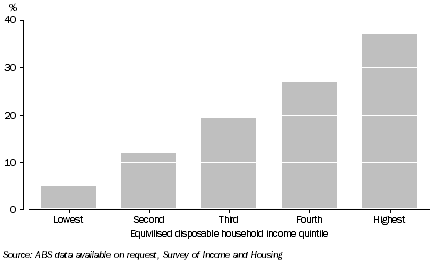
FHBs with a mortgage tend to have higher than average household incomes. In 2007-08, they had an average weekly gross income of $1,990, 21% higher than the average for all households. About two thirds (64%) of people in FHB households with a mortgage were in the top two quintiles (40%) of equivalised disposable household income in 2007-08 (see graph 10). Only 17% were in the bottom two quintiles (40%).
Over the period from 1995-96, the distribution of equivalised disposable household income of FHBs with a mortgage remained broadly unchanged. The proportion of people from FHB households with a mortgage who were in the bottom three equivalised disposable income quintiles decreased from 39% in 1995-96 to 36% in 2007-08.
10. Income Distribution, FHBs with a mortgage
- 2007-08
Between 2003-04 and 2007-08 the average real disposable income of people living in FHB households with a mortgage increased by 28%, on a par with the average increase for people living in all households (up 29% over the same period), but greater than the 25% for those living in what are described as 'low income households' i.e. those in the second and third equivalised disposable income deciles.
Home equity
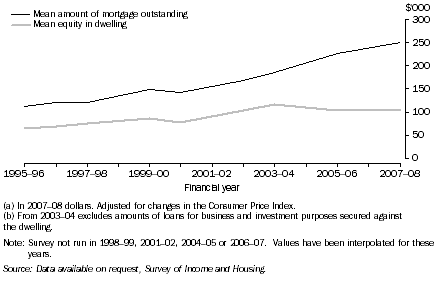
For many FHBs with a mortgage, the equity accumulated in their home represents the major part of their household wealth. Equity is measured as the value of the dwelling less the reported value of any outstanding loans secured against the dwelling. In 2007-08, FHBs with a mortgage had a mean dwelling equity of $105,000. Since 1995-96, the real mean dwelling equity of FHBs with a mortgage has increased by 64% (see graph 11).
The average amount of principal owed (mortgage outstanding) on the homes of FHBs with a mortgage was $251,000 in 2007-08, an increase of 124% in real terms since 1995-96. The faster rate of increase in the principal outstanding on FHB homes owned with a mortgage reflects the increases in house prices and therefore the mortgages taken out to acquire them, although some of the increased loan amounts may reflect borrowing for other, subsidiary purposes, as well as dwelling acquisition.
11. Mean mortgage outstanding and mean equity in dwelling (a) (b), FHBs with a mortgage
Housing costs
In this article housing costs for owners with a mortgage refer to rate payments and mortgage or unsecured loan payments, if the initial purpose of the loan was primarily to buy, add to or alter the dwelling. Additional housing costs incurred by owners such as repairs, maintenance and dwelling insurance were not collected in the 2007-08 or earlier SIHs.
In 2007-08 average weekly housing costs of FHBs with a mortgage were $510, or 26% of gross household income. Between 1995-96 and 2007-08, this amount rose by $192 per week (or 60%) in real terms (see graph 12), about the same as the increase in their real gross household incomes over the same period (up 61% from $1,238 to $1,991).
12. Average weekly housing costs (a), FHBs with a mortgage
The interest component of mortgage repayments for FHBs with a mortgage was the largest part of their weekly housing costs. In 2007-08, interest on the loan accounted for almost three quarters (74%) of the housing costs of FHBs with a mortgage, compared to 70% in 2005-06 and 64% in 2003-04. The interest on the loan in 2007-08 accounted for 71% of the housing costs of changeover buyers with a mortgage.
Disposable income less housing costs
The income available to FHBs with a mortgage to support other household consumption, after deducting housing costs from their disposable income, provides a further indication of their economic circumstances.
In 2007-08 the average disposable household income, less housing costs, was $1,082 per week for FHBs with a mortgage. In real terms, this has risen 62% from $669 per week in 1995-96 (see graph 13).
13. Mean weekly disposable income, housing costs and disposable income less housing costs (a), FHBs with a mortgage
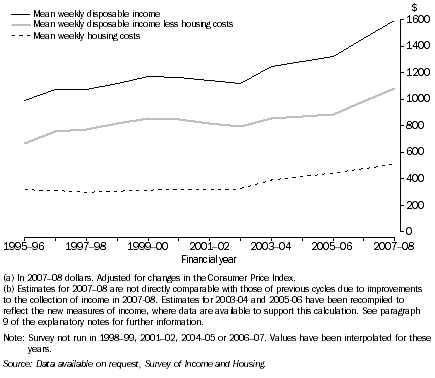
The principal component of mortgage repayments can be considered to be a form of saving rather than a recurrent housing cost. In 2007-08 the average principal component was $134 per week for FHBs with a mortgage. Excluding this from the measure of housing costs would result in an average disposable income net of housing costs of $1,216 per week in 2007-08.
Lower income households
Households with low or moderate incomes and limited reserves of wealth may have difficulty obtaining finance or meeting the ongoing costs of owning a home with a mortgage, particularly in periods when house prices are rising quickly.
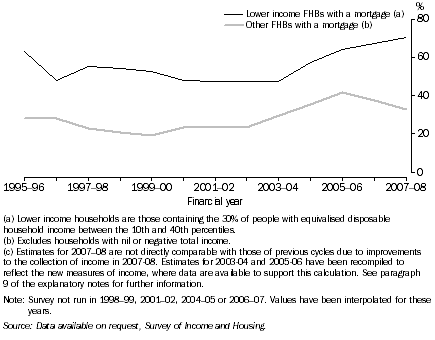
In this publication 'lower income households' have been defined as those containing the 30% of people with equivalised disposable household income between the 10th and 40th percentiles. While the majority of FHBs with a mortgage have higher than average incomes, 15% of FHBs with a mortgage were from lower income households. This proportion has remained broadly unchanged since 1995-96.
In 2007-08 the average age of the reference person in lower income FHB households with a mortgage was 36 years, compared to 32 years for other FHB households with a mortgage (see table 16 at the end of this article). They were less likely to be under 35 years of age than other FHB households (44% compared with 71%) and more likely to have dependent children (64% compared with 32%).
Lower income FHBs with a mortgage reported lower average dwelling values than other FHBs with a mortgage ($313,000 compared with $363,000) and lower weekly housing costs ($383 compared with $531).
Despite lower housing costs, lower income FHBs with a mortgage, on average, spend a greater proportion of their income on housing costs than other FHBs with a mortgage (37% compared to 25%). More than two-thirds (70%) of lower income FHBs with a mortgage spend more than 30% of their gross income on housing costs (see graph 14).
To varying extents, householder preferences may influence how much FHBs with a mortgage spend on housing costs. Some households may choose to live in an area with high housing costs because it is close to their place of employment. Others may choose to make higher mortgage repayments now, in order to pay off a mortgage faster, as a form of investment. However these options may be less available to lower income households.
14. Proportion of FHB with a mortgage who spend more than 30% of gross income in housing costs
PREVIOUS LIVING ARRANGEMENTS
Previous tenure and landlord type
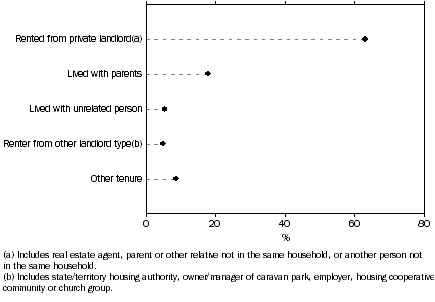
The path into home ownership for the majority (63%) of FHBs with a mortgage was from a dwelling rented from a private landlord. However, almost one in five (18%) FHBs with a mortgage lived with their parents (or other relatives) prior to purchasing their own home (see graph 15).
In 2007-08, South Australia and the Northern Territory had the highest proportion of FHBs with a mortgage who lived with their parents prior to purchasing their home (29% and 27% respectively), while Queensland and the ACT had the lowest proportion (7% and 11% respectively).
15. Reference person's tenure and landlord type of previous dwelling, FHBs with a mortgage - 2007-08
Location of previous dwelling
In selecting their new home, the majority (51%) of FHBs were most likely to choose a dwelling in the same suburb, town or locality as their previous dwelling. Only 2% of FHBs with a mortgage in 2007-08 reported that their previous dwelling was in a different state or territory.
SATISFACTION WITH CURRENT DWELLING
FHBs with a mortgage reported high levels of satisfaction with their current dwelling, with 89% reporting being either satisfied or very satisfied. This high level of satisfaction is only slightly lower than the levels reported by changeover buyers (92%) and all owner households (91%).
The highest levels of satisfaction were amongst FHBs with a mortgage living in Tasmania (98%), while the lowest levels of satisfaction was amongst those living in Western Australia (76%). Despite the generally high levels of satisfaction, over one in ten (11%) FHBs with a mortgage reported that they were likely to move home within the twelve months after being interviewed.
FURTHER INFORMATION
Microdata records in the Confidentialised Unit Record Files (CURFs) released by ABS from the SIH are available for analysis and include fields for first home buyers and changeover buyers.
A full range of up-to-date information about the availability of ABS CURFs and about applying for access to CURFs is available via the ABS web site <
https://www.abs.gov.au> (see Services We Provide, Confidentialised Unit Record Files (CURFs)). Inquiries to the ABS Microdata Access Strategies Section can be emailed to: microdata.access@abs.gov.au, or phone (02) 6252 7714.
16. First home buyers with a mortgage, Selected household characteristics, 1995-96 to 2007-08 |
|
| | | | 1995-96 | 1996-97 | 1997-98 | 1999-00 | 2000-01 | 2002-03 | 2003-04 | 2005-06 | 2007-08 |
Proportion of households with characteristic |
|
| Age group of reference person | | | | | | | | | | |
| 15 to 24 | % | 9.6 | 12.6 | 9.2 | 9.5 | 10.5 | 12.2 | 10.0 | 14.7 | 12.3 |
| 25 to 34 | % | 61.4 | 56.7 | 61.5 | 57.2 | 65.0 | 52.9 | 59.7 | 53.6 | 54.4 |
| 35 to 44 | % | 23.4 | 22.4 | 22.0 | 24.8 | 19.0 | 25.6 | 23.2 | 21.7 | 26.7 |
| 45 to 54 | % | *4.2 | 6.1 | 5.1 | 7.5 | *4.8 | 7.6 | 4.4 | 7.6 | *5.2 |
| 44 to 64 | % | **0.9 | *2.2 | *2.1 | **1.0 | **0.7 | *1.7 | *2.3 | *1.6 | **1.2 |
| 65 and over | % | **0.5 | - | - | - | - | **0.1 | **0.4 | **0.8 | **0.3 |
| Total | % | 100.0 | 100.0 | 100.0 | 100.0 | 100.0 | 100.0 | 100.0 | 100.0 | 100.0 |
| Family composition of household | | | | | | | | | | |
| One family households | | | | | | | | | | |
| | Couple family with dependent children | % | 36.6 | 36.2 | 34.7 | 35.1 | 30.5 | 33.6 | 31.4 | 34.6 | 32.4 |
| | One parent family with dependent children | % | *3.4 | *2.7 | 3.2 | *4.1 | *4.0 | 4.4 | 4.7 | *2.7 | *4.0 |
| | Couple only | % | 32.0 | 31.0 | 34.1 | 30.8 | 34.5 | 29.4 | 34.6 | 33.5 | 32.6 |
| | Other one family households | % | *3.9 | *4.4 | *5.1 | *4.7 | 6.1 | 5.7 | 4.0 | *5.3 | *4.0 |
| Multiple family households | % | - | **1.8 | *2.4 | **1.8 | **0.2 | *1.0 | **0.3 | **0.6 | **1.6 |
| Non-family households | | | | | | | | | | |
| | Lone person | % | 17.4 | 18.4 | 14.9 | 14.8 | 16.9 | 20.2 | 20.0 | 20.0 | 22.1 |
| | Group households | % | 6.8 | 5.5 | *5.6 | 8.7 | 7.8 | 5.7 | 5.1 | *3.3 | *3.4 |
| Total | % | 100.0 | 100.0 | 100.0 | 100.0 | 100.0 | 100.0 | 100.0 | 100.0 | 100.0 |
| Number of employed persons | | | | | | | | | | |
| None | % | 5.6 | 5.1 | *4.4 | *3.5 | *4.2 | 4.7 | *3.9 | *1.7 | *2.8 |
| One | % | 36.0 | 39.6 | 36.5 | 37.4 | 38.2 | 41.0 | 37.8 | 40.9 | 39.4 |
| Two | % | 54.6 | 50.1 | 54.7 | 51.4 | 52.6 | 50.4 | 54.2 | 54.1 | 51.9 |
| Three or more | % | *3.8 | *5.2 | *4.4 | *7.7 | *5.0 | *3.9 | 4.1 | *3.4 | *6.0 |
| Total | % | 100.0 | 100.0 | 100.0 | 100.0 | 100.0 | 100.0 | 100.0 | 100.0 | 100.0 |
| Level of highest non-school qualification (of reference person) | | | | | | | | | | |
| Bachelor degree or higher | % | 18.0 | 19.0 | 17.4 | 19.9 | 23.7 | 22.4 | 30.2 | 33.1 | 40.4 |
| Advanced diploma and diploma or below | % | 39.6 | 40.3 | 37.1 | 40.4 | 38.2 | 36.5 | 37.8 | 36.8 | 33.8 |
| No non-school qualification | % | 42.4 | 40.8 | 45.5 | 39.4 | 37.5 | 38.9 | 30.8 | 29.0 | 25.3 |
| Total(a) | % | 100.0 | 100.0 | 100.0 | 100.0 | 100.0 | 100.0 | 100.0 | 100.0 | 100.0 |
| Dwelling structure | | | | | | | | | | |
| Separate house | % | 84.7 | 82.7 | 82.5 | 81.9 | 80.6 | 77.0 | 82.8 | 72.3 | 70.9 |
| Semi-detached/row or terrace house/townhouse | % | 7.9 | 10.0 | *6.4 | 10.7 | 8.3 | 11.1 | 9.8 | 15.2 | 10.1 |
| Flat/unit/apartment | % | 7.4 | 7.3 | 10.8 | *7.1 | *10.6 | 11.6 | 7.4 | 11.5 | 19.0 |
| Total(b) | % | 100.0 | 100.0 | 100.0 | 100.0 | 100.0 | 100.0 | 100.0 | 100.0 | 100.0 |
| New or established dwelling | | | | | | | | | | |
| New dwelling | % | 22.7 | 23.1 | 17.4 | 15.5 | 19.5 | 21.3 | 17.6 | 13.5 | 8.9 |
| Established dwelling | % | 77.3 | 76.9 | 82.6 | 84.5 | 80.5 | 78.7 | 82.4 | 86.5 | 91.1 |
| Total | % | 100.0 | 100.0 | 100.0 | 100.0 | 100.0 | 100.0 | 100.0 | 100.0 | 100.0 |
| Number of bedrooms in dwelling | | | | | | | | | | |
| One bedroom | % | *2.2 | *1.8 | **1.0 | *1.4 | *1.8 | *1.6 | *2.5 | *3.0 | *6.3 |
| Two bedrooms | % | 22.7 | 21.2 | 22.9 | 21.9 | 21.0 | 21.8 | 21.4 | 22.5 | 26.1 |
| Three bedrooms | % | 61.5 | 58.4 | 57.7 | 56.2 | 57.1 | 54.2 | 57.4 | 53.8 | 50.3 |
| Four bedrooms | % | 13.0 | 17.0 | 16.4 | 19.0 | 18.1 | 20.6 | 16.5 | 19.1 | 16.3 |
| Five or more bedrooms | % | **0.7 | *1.6 | *1.9 | **1.5 | *2.0 | *1.8 | *2.1 | *1.5 | **1.0 |
| Total(c) | % | 100.0 | 100.0 | 100.0 | 100.0 | 100.0 | 100.0 | 100.0 | 100.0 | 100.0 |
| Equivalised disposable household income(d)(e) | | | | | | | | | | |
| Lowest quintile | % | 7.2 | 10.8 | 9.1 | 9.8 | 8.5 | 7.7 | 7.5 | 6.8 | *5.0 |
| Second quintile | % | 13.3 | 9.5 | 9.0 | 9.8 | 9.5 | 15.1 | 9.5 | 10.3 | 11.9 |
| Third quintile | % | 18.3 | 16.3 | 21.3 | 17.4 | 17.5 | 21.0 | 18.9 | 21.9 | 19.4 |
| Fourth quintile | % | 24.4 | 21.3 | 25.6 | 25.4 | 27.2 | 23.3 | 29.1 | 28.2 | 26.8 |
| Highest quintile | % | 36.7 | 42.1 | 34.9 | 37.6 | 37.3 | 32.9 | 35.0 | 32.8 | 37.0 |
| Total | % | 100.0 | 100.0 | 100.0 | 100.0 | 100.0 | 100.0 | 100.0 | 100.0 | 100.0 |
| Second and third deciles | % | 9.8 | 9.4 | 7.6 | 10.2 | 7.5 | 8.4 | 7.5 | 9.0 | 6.9 |
|
|
| | | | | | | | | | |
| Average age of reference person | years | 32 | 32 | 32 | 33 | 31 | 33 | 33 | 32 | 32 |
| Average number of persons in household | no. | 2.60 | 2.66 | 2.62 | 2.70 | 2.51 | 2.58 | 2.48 | 2.50 | 2.46 |
| Average number of bedrooms in dwelling | no. | 2.88 | 2.95 | 2.96 | 2.97 | 2.98 | 2.99 | 2.95 | 2.94 | 2.80 |
| | | | | | | | | | |
| Mean value of dwelling in 2007-08 dollars(f) | $'000 | 176 | 190 | 194 | 234 | 220 | 271 | 300 | 330 | 356 |
| Mean amount of mortgage outstanding in 2007-08 dollars(f) | $'000 | 112 | 121 | 120 | 148 | 142 | 168 | 185 | 226 | 251 |
| Mean equity in dwelling in 2007-08 dollars(f) | $'000 | 64 | 69 | 74 | 86 | 78 | 103 | 115 | 104 | 105 |
| | | | | | | | | | |
| Mean gross weekly household income in 2007-08 dollars(e)(f) | $ | 1 238 | 1 375 | 1 349 | 1 531 | 1 490 | 1 424 | 1 583 | 1 682 | 1 991 |
| Mean disposable weekly household income in 2007-08 dollars(e)(f) | $ | 987 | 1 070 | 1 070 | 1 171 | 1 168 | 1 119 | 1 248 | 1 325 | 1 592 |
| Mean weekly housing costs in 2007-08 dollars(f) | $ | 318 | 312 | 297 | 313 | 322 | 323 | 390 | 442 | 510 |
| Mean disposable weekly household income less housing costs in 2007-08 dollars(e)(f) | $ | 669 | 758 | 773 | 858 | 846 | 796 | 857 | 883 | 1 082 |
| Housing costs as a proportion of gross income(e)(g) | % | 26 | 23 | 22 | 20 | 22 | 23 | 25 | 26 | 26 |
| | | | | | | | | | |
| Estimated number of households | '000 | 318.2 | 329.9 | 387.1 | 328.3 | 358.2 | 384.2 | 372.8 | 303.3 | 292.2 |
| Number of households in sample | no. | 331 | 362 | 373 | 299 | 318 | 507 | 547 | 363 | 341 |
|
| * estimate has a relative standard error of 25% to 50% and should be used with caution |
| ** estimate has a relative standard error greater than 50% and is considered too unreliable for general use |
| - nil or rounded to zero (including null cells) |
| (a) Includes level not determined. |
| (b) Includes other dwelling types. |
| (c) Includes bed-sits and dwellings with no bedrooms. |
| (d) See paragraphs 39 to 46 of the explanatory notes. |
| (e) Estimates for 2007-08 are not directly comparable with those of previous cycles due to improvements to the collection of income in 2007-08. Estimates for 2003-04 and 2005-06 have been recompiled to reflect the new measures of income, where data are available to support this calculation. See paragraph 9 of the explanatory notes for further information. |
| (f) Adjusted for changes in the Consumer Price index. |
| (g) Excludes households with nil or negative total income. |
17. First home buyers with a mortgage, 2007-08 |
|
| | | | Lower income FHBs with a mortgage(a) | Other FHBs with a mortgage | All FHBs with a mortgage |
Proportion of households with characteristic |
|
| Age group of reference person | | | | |
| 15 to 24 | % | *15.2 | 11.8 | 12.3 |
| 25 to 34 | % | 28.7 | 58.7 | 54.4 |
| 35 to 44 | % | 43.0 | 23.9 | 26.7 |
| 45 to 54 | % | **6.2 | *5.0 | *5.2 |
| 44 to 64 | % | **7.0 | **0.3 | **1.2 |
| 65 and over | % | - | **0.3 | **0.3 |
| Total | % | 100.0 | 100.0 | 100.0 |
| Family composition of household | | | | |
| One family households | | | | |
| | Couple family with dependent children | % | 57.1 | 28.3 | 32.4 |
| | One parent family with dependent children | % | **7.2 | *3.4 | *4.0 |
| | Couple only | % | *15.4 | 35.5 | 32.6 |
| | Other one family households | % | **0.5 | *4.6 | *4.0 |
| Multiple family households | % | - | **1.9 | **1.6 |
| Non-family households | | | | |
| | Lone person | % | *19.9 | 22.4 | 22.1 |
| | Group households | % | - | *3.9 | *3.4 |
| Total | % | 100.0 | 100.0 | 100.0 |
| Number of employed persons | | | | |
| None | % | **9.7 | *1.6 | *2.8 |
| One | % | 57.7 | 36.3 | 39.4 |
| Two | % | *26.5 | 56.2 | 51.9 |
| Three or more | % | **6.1 | *6.0 | *6.0 |
| Total | % | 100.0 | 100.0 | 100.0 |
| Housing costs as a proportion of gross income(b) | | | | |
| 25% or less | % | *19.0 | 47.5 | 43.4 |
| More than 25% to 30% | % | **8.8 | 19.8 | 18.2 |
| More than 30% to 50% | % | 41.2 | 26.0 | 28.2 |
| More than 50% | % | 31.0 | 6.7 | 10.2 |
| Total | % | 100.0 | 100.0 | 100.0 |
|
|
| | | | |
| Average age of reference person | years | 36 | 32 | 32 |
| Average number of persons in household | no. | 3.08 | 2.35 | 2.46 |
| | | | |
| Mean value of dwelling | $'000 | 313 | 363 | 356 |
| Mean amount of mortgage outstanding | $'000 | 212 | 257 | 251 |
| Mean equity in dwelling | $'000 | 101 | 105 | 105 |
| | | | |
| Mean gross weekly household income | $ | 1 024 | 2 154 | 1 991 |
| Mean disposable weekly household income | $ | 924 | 1 704 | 1 592 |
| Mean weekly housing costs | $ | 383 | 531 | 510 |
| Mean disposable weekly household income less housing costs | $ | 541 | 1 174 | 1 082 |
| Housing costs as a proportion of gross income | % | 37 | 25 | 26 |
| | | | |
| Estimated number of households | '000 | 42.2 | 250.0 | 292.2 |
| Number of households in sample | no. | 47 | 294 | 341 |
|
| * estimate has a relative standard error of 25% to 50% and should be used with caution |
| ** estimate has a relative standard error greater than 50% and is considered too unreliable for general use |
| - nil or rounded to zero (including null cells) |
| (a) Lower income households are those containing the 30% of people with equivalised disposable household income between the 10th and 40th percentiles. |
| (b) Excludes households with nil or negative total income. |
18. First home buyers with a mortgage, Selected chatacteristics, 2007-08 |
|
| | | NSW | Vic. | Qld | SA | WA | Tas. | NT(a) | ACT | Aust. |
|
| Whether had deposit for dwelling | | | | | | | | | | |
| Had a deposit for dwelling | % | 83.0 | 95.7 | 88.5 | 86.7 | 75.2 | 82.6 | 100.0 | 82.9 | 86.5 |
| Did not have deposit for dwelling | % | *17.0 | **4.3 | *11.5 | *13.3 | *24.8 | **17.4 | - | **17.1 | 13.5 |
| Total | % | 100.0 | 100.0 | 100.0 | 100.0 | 100.0 | 100.0 | 100.0 | 100.0 | 100.0 |
| All sources of funds for home deposit(b) | | | | | | | | | | |
| First Home Owners Grant | % | 46.3 | 45.4 | 40.8 | 52.4 | 46.5 | *47.1 | *41.7 | *29.3 | 45.2 |
| Savings | % | 71.2 | 84.1 | 75.5 | 81.5 | 70.2 | 67.3 | 88.7 | 82.9 | 76.0 |
| Gift from family or friends | % | *14.6 | *14.8 | **4.8 | *6.8 | **10.3 | **11.3 | **4.1 | *34.8 | 12.2 |
| Loan from family or friends | % | *6.4 | *8.1 | **3.5 | **3.8 | **3.7 | - | - | **9.6 | 5.6 |
| Other source of deposit(c) | % | *8.7 | *17.4 | *7.8 | **1.3 | **8.1 | **21.2 | **3.0 | **24.2 | 10.4 |
| All households with a deposit | % | 83.0 | 95.7 | 88.5 | 86.7 | 75.2 | 82.6 | 100.0 | 82.9 | 86.5 |
| Did not have deposit for dwelling | % | *17.0 | **4.3 | *11.5 | *13.3 | *24.8 | **17.4 | - | **17.1 | 13.5 |
| Total | % | 100.0 | 100.0 | 100.0 | 100.0 | 100.0 | 100.0 | 100.0 | 100.0 | 100.0 |
| Deposit as a proportion of purchase price | | | | | | | | | | |
| No deposit | % | *17.0 | **4.3 | *11.5 | *13.3 | *24.8 | **17.4 | - | **17.1 | 13.5 |
| Less than 5% | % | *7.6 | 29.2 | 33.4 | 34.4 | *27.9 | *40.9 | *64.8 | **7.9 | 22.6 |
| 5% to less than 10% | % | 23.4 | *22.5 | *21.4 | 30.6 | *16.7 | *20.4 | **8.2 | *37.8 | 23.0 |
| 10% to less than 20% | % | 27.7 | *21.7 | *17.7 | *15.1 | *17.1 | **12.1 | **10.2 | **13.9 | 21.6 |
| 20% or more | % | *24.3 | 22.4 | *15.9 | **6.6 | *13.6 | **9.1 | **16.7 | *23.3 | 19.4 |
| Total | % | 100.0 | 100.0 | 100.0 | 100.0 | 100.0 | 100.0 | 100.0 | 100.0 | 100.0 |
| Whether received monetary assistance to purchase home | | | | | | | | | | |
| Received monetary assistance | % | 71.7 | 80.4 | 73.4 | 88.8 | 75.3 | 91.4 | 83.3 | 88.4 | 76.8 |
| Did not receive monetary assistance | % | 28.3 | 19.6 | *26.6 | *11.2 | 24.7 | **8.6 | **16.7 | **11.6 | 23.2 |
| Total | % | 100.0 | 100.0 | 100.0 | 100.0 | 100.0 | 100.0 | 100.0 | 100.0 | 100.0 |
| All sources of monetary assistance to purchase home(b) | | | | | | | | | | |
| First Home Owners Grant | % | 71.7 | 80.4 | 71.2 | 88.8 | 72.5 | 86.3 | 83.3 | 85.7 | 76.0 |
| Gift from family or friends | % | *8.2 | *16.5 | **7.3 | *13.1 | *12.2 | **11.3 | - | *37.5 | 11.5 |
| State or territory government concessions or exemptions | % | *8.6 | - | **2.2 | **4.9 | **4.6 | **9.7 | **12.4 | **8.5 | *5.0 |
| Other monetary assistance(d) | % | *7.0 | *19.3 | **6.0 | **3.2 | **6.7 | **8.7 | - | **14.4 | 9.3 |
| All households that received monetary assistance | % | 71.7 | 80.4 | 73.4 | 88.8 | 75.3 | 91.4 | 83.3 | 88.4 | 76.8 |
| Did not receive monetary assistance | % | 28.3 | 19.6 | *26.6 | *11.2 | 24.7 | **8.6 | **16.7 | **11.6 | 23.2 |
| Total | % | 100.0 | 100.0 | 100.0 | 100.0 | 100.0 | 100.0 | 100.0 | 100.0 | 100.0 |
| Previous tenure and landlord type (of reference person) | | | | | | | | | | |
| Rented from private landlord(e) | % | 65.9 | 66.4 | 70.3 | 50.8 | 53.3 | *44.5 | **27.7 | *55.4 | 63.0 |
| Lived with parents | % | 17.9 | *22.3 | *7.3 | *29.1 | *19.3 | **12.9 | **27.0 | **10.8 | 17.9 |
| Lived with unrelated person | % | **4.8 | **3.2 | **6.8 | **8.5 | **3.6 | **12.2 | **22.7 | **6.7 | 5.4 |
| Rented from other landlord type(f) | % | **5.4 | **3.5 | **4.1 | - | **9.8 | **16.6 | **7.8 | **8.6 | *5.1 |
| Other tenure | % | *4.4 | **4.6 | *11.5 | *9.0 | *11.1 | **7.6 | **14.8 | **15.1 | 7.2 |
| Total(g) | % | 100.0 | 100.0 | 100.0 | 100.0 | 100.0 | 100.0 | 100.0 | 100.0 | 100.0 |
| Geographical area of previous dwelling (of reference person) | | | | | | | | | | |
| In same suburb/locality | % | 54.8 | 25.0 | 69.1 | 61.6 | 56.1 | *35.8 | 72.8 | *38.4 | 50.8 |
| In same statet/territory - capital city | % | 30.2 | 57.5 | *12.1 | *18.3 | 34.3 | **9.4 | **21.9 | *36.7 | 32.0 |
| In same state/territory - other than capital city | % | *10.3 | *15.6 | *18.8 | *11.7 | **6.8 | *40.6 | - | - | 13.0 |
| In different state/territory | % | **2.9 | **1.8 | - | **3.9 | - | **7.9 | **5.2 | **9.8 | *2.3 |
| Total(h) | % | 100.0 | 100.0 | 100.0 | 100.0 | 100.0 | 100.0 | 100.0 | 100.0 | 100.0 |
| Structure of previous dwelling (of reference person) | | | | | | | | | | |
| Separate house | % | 53.4 | 53.9 | 62.9 | 78.1 | 68.0 | 88.8 | 70.2 | 76.5 | 60.4 |
| Semi-detached/row or terrace house/townhouse | % | 19.3 | 24.1 | **7.8 | *15.1 | *13.6 | - | **3.0 | **7.5 | 16.5 |
| Flat/unit/apartment | % | 24.4 | *21.0 | *29.3 | **4.2 | *9.1 | **5.0 | **19.4 | **12.5 | 20.4 |
| Total(i) | % | 100.0 | 100.0 | 100.0 | 100.0 | 100.0 | 100.0 | 100.0 | 100.0 | 100.0 |
| All reasons for last move (of reference person)(b) | | | | | | | | | | |
| Wanted bigger/better home | % | *10.1 | **4.6 | **2.4 | *13.3 | **4.6 | **6.6 | **7.3 | **5.0 | 7.0 |
| Purchased own dwelling | % | 81.2 | 82.7 | 83.1 | 53.4 | 67.0 | *40.4 | 92.2 | *50.5 | 76.4 |
| Other housing reasons(j) | % | **2.1 | **1.6 | **5.9 | **2.9 | **4.2 | **5.0 | - | - | *2.9 |
| Employment reasons(k) | % | **0.9 | **3.2 | **6.6 | **2.4 | **6.4 | **15.9 | - | **11.5 | *3.7 |
| Get married/live with partner | % | **2.9 | *10.9 | - | *9.0 | *10.1 | **14.5 | - | **11.9 | 5.9 |
| Other family reasons(l) | % | **2.6 | **2.9 | *6.1 | *14.6 | **6.3 | - | **7.8 | **11.9 | *4.9 |
| Lifestyle/other reasons(m) | % | **3.0 | **6.1 | **1.4 | **4.6 | **3.8 | **16.3 | - | **5.6 | *4.0 |
| Total(g) | % | 100.0 | 100.0 | 100.0 | 100.0 | 100.0 | 100.0 | 100.0 | 100.0 | 100.0 |
| Number of times moved in the last five years (reference person) | | | | | | | | | | |
| One | % | 33.2 | 37.5 | *30.3 | 34.5 | 28.0 | *33.4 | *40.3 | 38.0 | 33.5 |
| Two | % | *16.6 | *18.8 | *19.2 | *16.6 | 28.0 | **12.6 | **16.3 | *24.1 | 18.8 |
| Three | % | 22.5 | 23.4 | 22.4 | 28.8 | *11.2 | *28.3 | **22.0 | *17.6 | 22.1 |
| Four | % | *13.6 | **2.6 | *6.8 | *9.7 | **4.4 | **19.5 | **11.1 | - | 8.5 |
| Five or more | % | *4.2 | *15.4 | 21.3 | **4.4 | *19.1 | - | **10.4 | **16.8 | 11.4 |
| Total(n) | % | 100.0 | 100.0 | 100.0 | 100.0 | 100.0 | 100.0 | 100.0 | 100.0 | 100.0 |
| Satisfaction with current dwelling (of reference person) | | | | | | | | | | |
| Very satisfied | % | 45.9 | 32.6 | 34.8 | 34.6 | *20.7 | *37.0 | *55.4 | 43.9 | 37.4 |
| Satisfied | % | 46.7 | 54.3 | 51.2 | 59.7 | 55.1 | 60.8 | *40.4 | 52.9 | 51.5 |
| Neither satisfied nor dissatisfied | % | **3.7 | *11.4 | *12.0 | **3.2 | *14.2 | **2.2 | - | **3.1 | 7.7 |
| Dissatisfied | % | **2.1 | **1.7 | **2.1 | **2.5 | **7.0 | - | **4.2 | - | *2.5 |
| Very dissatisfied | % | - | - | - | - | - | - | - | - | - |
| Total(o) | % | 100.0 | 100.0 | 100.0 | 100.0 | 100.0 | 100.0 | 100.0 | 100.0 | 100.0 |
| Likelihood of moving within next 12 months (reference person) | | | | | | | | | | |
| Likely to move in next 12 months | % | *9.7 | *7.3 | *17.0 | - | *14.1 | **9.9 | *40.6 | **12.4 | 10.5 |
| Unlikely to move in next 12 months | % | 88.7 | 86.9 | 78.4 | 96.9 | 85.9 | 86.1 | *51.5 | 84.8 | 86.4 |
| Total(n) | % | 100.0 | 100.0 | 100.0 | 100.0 | 100.0 | 100.0 | 100.0 | 100.0 | 100.0 |
| | | | | | | | | | |
| Estimated number of households | '000 | 104.8 | 64.3 | 50.6 | 25.5 | 28.7 | 6.9 | *3.3 | 8.1 | 292.2 |
| Number of households in sample | no. | 80 | 59 | 47 | 51 | 44 | 20 | 15 | 25 | 341 |
|
| * estimate has a relative standard error of 25% to 50% and should be used with caution |
| ** estimate has a relative standard error greater than 50% and is considered too unreliable for general use |
| - nil or rounded to zero (including null cells) |
| (a) Excludes households in collection districts defined as very remote, accounting for about 23% of the population in the Northern Territory. |
| (b) Categories are not mutually exclusive. |
| (c) Includes inheritance, sale of car/other possessions, state/territory government grant. |
| (d) Includes state/territory government grant. |
| (e) Includes real estate agent, parent or other relative not in the same household, or another person not in the same household. |
| (f) Includes state/territory housing authority, owner/manager of caravan park, employer, housing cooperative, community or church group. |
| (g) Includes lived in current dwelling for five years or more. |
| (h) Includes overseas and lived in current dwelling for five years or more. |
| (i) Includes other dwelling structure and lived in current dwelling for five years or more. |
| (j) Includes wanted smaller home and notice given by landlord. |
| (k) Includes gained/lost job, job transfer and to improve job prospects. |
| (l) Includes be close to family/friends, family conflict, breakdown of marriage/relationship, to be independent. |
| (m) Includes responses such as lifestyle reasons, neighbourhood reasons, migration to Australia, returned from living overseas, had been travelling and not known. |
| (n) Includes not known and lived in current dwelling for five years or more. |
| (o) Includes no response. |
 Print Page
 Print All