ABOUT THIS PUBLICATION
This publication presents a summary of the results from the 2003-04 Household Expenditure Survey (HES), which was a subsample of the households comprising the 2003-04 Survey of Income and Housing (SIH). The HES collected information on the expenditure, income, net worth and other characteristics of households resident in private dwellings throughout Australia.
CHANGES IN THIS ISSUE
The 2003-04 HES and SIH included an expanded range of questions to collect details about income, and for the first time included a comprehensive range of questions to collect details about the assets and liabilities of the household.
Changes in the contents of this issue are:
- the inclusion of household net worth data in most tables, and the introduction of a new table showing expenditure by net worth quintile
- the introduction of equivalised disposable household income as an additional indicator of a household's relative wellbeing when compared to other households of different size and composition
- the replacement of the data item "household composition" with the data item "family composition of household"
- the replacement of the household characteristic "source of income" with "principal source of household income"
- the inclusion of tables showing expenditure on each of the broad expenditure groups as a proportion of total goods and services expenditure
- the restructure of the tables so that they closely resemble the tables in Household Income and Income Distribution, Australia, 2003-04 (cat. no. 6523.0), facilitating comparison between the two datasets.
Integrating the HES and SIH has resulted in:
- reduced respondent burden
- the HES sample weights being calibrated to the same set of independent demographic benchmarks as the SIH
- the HES sample weights being calibrated to SIH estimates of the number of households by tenure type and SIH estimates of aggregate household income by state and territory and broad source of income
- changes to the definitions of a number of data items, such as income, so that they are identical to the corresponding definitions used in the SIH
- changes to the derivation process used to estimate income tax liability to only use data items available in the SIH.
EFFECTS OF ROUNDING
Where figures have been rounded, discrepancies may occur between sums of the component items and totals. Published percentages are calculated prior to rounding of the figures and therefore some discrepancy may exist between these percentages and those that could be calculated from the rounded figures.
INQUIRIES
For further information about these and related statistics, contact the National Information and Referral Service on 1300 135 070 or Jan Gatenby on Canberra (02) 6252 6174.
SUMMARY OF FINDINGS
HOUSEHOLD EXPENDITURE ON GOODS AND SERVICES - OVERVIEW
In the 12 months to June 2004, Australian households spent an average of $883 each week on goods and services. This is an increase of 26% since the previous survey which was conducted in 1998-99. Part of this increase can be attributed to inflation - over the five years since the previous survey, the price of goods and services, as measured by the consumer price index (CPI), rose by 18%. Over the same period, the mean gross household income per week increased by 28% and the average household size decreased from 2.60 people to 2.53 people.
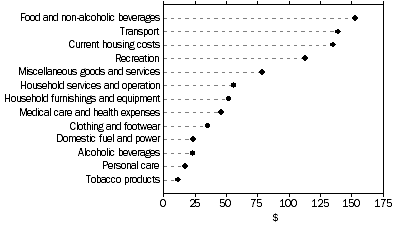
In 2003-04 the largest broad categories of household expenditure were:
- food and non-alcoholic beverages, with average household expenditure of $153 per week, representing 17% of total household expenditure on goods and services
- transport, $139 per week, 16% of the total
- current housing costs, $135 per week, 15% of the total.
As in 1998-99, these categories together accounted for around half of household expenditure on goods and services. The next highest category was recreation, with average weekly household expenditure of $113 per week, representing 13% of the total.
AVERAGE WEEKLY HOUSEHOLD EXPENDITURE ON GOODS AND SERVICES

DIFFERENCES BETWEEN HOUSEHOLDS
The level and pattern of expenditure differs between households, reflecting characteristics such as income, wealth, household composition, household size and location.
Household Income
Gross household Income
In 2003-04, households in the lowest gross income quintile (the lowest 20% of households when ranked according to gross income) spent on average $412 on goods and services per week, compared to $1,484 by households in the highest gross income quintile. This difference in expenditure is partly a consequence of household size: households in the lowest quintile contain on average 1.5 persons, compared to 3.4 persons in households in the highest quintile. Lone person households make up 63% of households in the lowest quintile.
Equivalised disposable household income
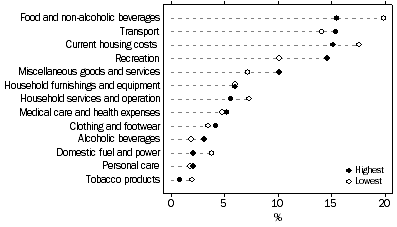
Equivalised disposable household income provides an indicator of the relative standard of living of households of different size and composition. The composition of household expenditure differs between equivalised disposable household income quintile groups. For example, food and non-alcoholic beverages accounted for 20% of the expenditure on goods and services of households in the lowest equivalised income quintile, compared to 16% for households in the highest quintile. In general, the proportion spent on domestic fuel and power, tobacco and household services also declined as equivalised disposable income rose, while the proportion spent on recreation, clothing and footwear, alcohol, personal care and miscellaneous goods and services increased.
PROPORTION OF EXPENDITURE ALLOCATED TO GOODS AND SERVICES BY THE LOWEST AND HIGHEST EQUIVALISED INCOME QUINTILE GROUPS

Household net worth
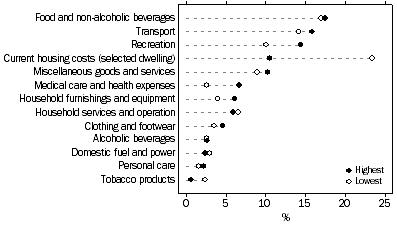
Current housing costs is the broad expenditure group most related to levels of household net worth. Current housing costs comprised 23% of total expenditure on goods and services for households in the lowest net worth quintile but only 11% for households in the highest quintile.
For many households, the dwelling in which they live is the main asset. Households with low net worth are likely to have a high mortgage offsetting the value of the dwelling, or are likely to be renting. They therefore tend to have high housing costs, either in the form of interest payments on their mortgage or in the form of rent. Households with high net worth are more likely to own their own home with only a small or no mortgage outstanding, and therefore only have low housing costs. Only 4.5% of households in the lowest net worth quintile own their own home, compared to 97% in the highest quintile.
Expenditure on medical care and health expenses tends to be substantially higher for households with higher net worth, accounting for 2.6% of expenditure for households in the lowest quintile and 6.7% for households in the highest quintile. In part this may reflect the older ages of persons in the higher quintiles. The average age of the reference person in the lowest net worth quintile is 41 years compared to 55 years for the highest quintile, both quintiles have a household average of 0.6 persons under the age of 18, and the average number of persons 65 years and over is 0.2 in the lowest net worth quintile and 0.4 in the highest quintile.
In general, the proportion spent on recreation, household furnishings and equipment, and clothing and footwear rose as net worth rose, while the proportion spent on tobacco dropped substantially.
PROPORTION OF EXPENDITURE ALLOCATED TO GOODS AND SERVICES BY THE LOWEST AND HIGHEST NET WORTH QUINTILE GROUPS

Social and demographic characteristics
The level and composition of household income and expenditure is highly related to the social and demographic characteristics of household members. For example, households in the lowest equivalised disposable income quintile were more likely to be lone person households and to rely on government pensions and allowances as their principal source of income. Similarly, households in the highest quintile were more likely to be couple, one family households and to have wages and salaries as their principal source of income.
Households in which the levels of weekly expenditure on goods and services was significantly below the average of $883 for all households included:
- households which relied on government pensions and allowances as their major source of income, with average weekly expenditure of $455
- households which rented their dwelling from a state or territory housing authority, with average weekly expenditure of $408
- lone person households, with average weekly expenditure of $483
- households in which the reference person was 65 years and over, with average weekly expenditure of $509.
In contrast, households in which the level of expenditure on goods and services was significantly above the average included:
- households with principal source of income of wages and salaries, with average weekly expenditure of $1,077
- households purchasing their home (with a mortgage), with average weekly expenditure of $1,123
- couple, one family households with children; for example households consisting of a couple with their dependent and non-dependent children only, had an average weekly expenditure of $1,521
- multiple family households, with average weekly expenditure of $1,390
- households in which the reference person was aged 45 to 54 years, with average weekly expenditure of $1,066.
Household characteristics can also help to explain the variation in the composition of expenditure. For example, housing costs accounted for only 8% of total expenditure on goods and services of those households who owned their home outright; at the other extreme, households renting from private landlords spent 23% of their total expenditure on housing.
Location
The level of expenditure varied across states and territories. Households in the Australian Capital Territory recorded the highest average weekly expenditure at $1,052, followed by those in Northern Territory at $1,038. The lowest expenditure was in Tasmania at $753 per week.
Expenditure also varied between capital cities and elsewhere. The average weekly expenditure of households located in capital cities was $938, compared with $789 in areas other than capital cities. The capital cities with the highest average weekly expenditures were Darwin at $1,080 per week, Canberra at $1,052 and Sydney at $1,022. However, the differences between Darwin, Canberra and Sydney are not large enough to be significant at the 95% confidence level (see Appendix 2).
CHANGES SINCE 1998-99
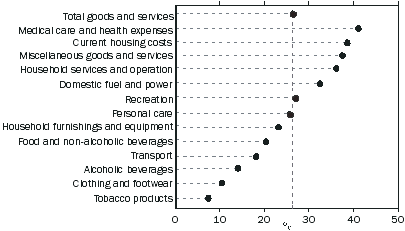
The overall increase in average weekly household expenditure on goods and services between 1998-99 and 2003-04 was $184 or 26%. Over the same period the price of goods and services, as measured by the CPI, rose by 18%.
The broad expenditure categories recording the largest increases in dollar terms in average weekly expenditure were:
- Current housing costs (selected dwelling), up $38 (39%), due in part to increased mortgage interest payments, up $12 (47%) and increased rent payments, up $9 (23%)
- food and non-alcoholic beverages, up $26 (20%)
- recreation, up $24 (27%)
- transport, up $21 (18%), with increases in the purchase of both motor vehicles and petrol (16% and 26% respectively)
- miscellaneous goods and services, up $21 (37%), partly due to increased spending on interest payments on selected credit services (excluding loan payments for selected dwelling), up $8 (79%).
At the more detailed expenditure items level (see Household Expenditure Survey, Detailed Items, 2003-04 (cat no. 6535.0.55.001), some of the most significant spending increases over the 5 year period were on mobile phone charges (up 183%), interest payments on mortgages (up 47%), health practitioners' fees (up 44%), education fees (up 41%), child care (up 34%), health and accident insurance (up 34%), domestic fuel and power (up 32%) and petrol (up 26%).
INCREASE IN AVERAGE WEEKLY EXPENDITURE ON GOODS AND SERVICES 1998–99 TO 2003–04

 Print Page
 Print All