AUGUST KEY FIGURES
 | June 2005 | July 2005 | August 2005 | Jul 05 to Aug 05 |  |
 | $m | $m | $m | % change |  |
Trend |  |
|  |
| Balance on goods & services | -1 398 | -1 391 | -1 412 | . . |  |
| Credits (exports of goods & services) | 14 897 | 14 980 | 15 030 | - |  |
| Debits (imports of goods & services) | 16 295 | 16 371 | 16 442 | - |  |
Seasonally Adjusted |  |
|  |
| Balance on goods & services | -1 344 | -1 333 | -1 639 | . . |  |
| Credits (exports of goods & services) | 14 832 | 15 227 | 14 703 | -3 |  |
| Debits (imports of goods & services) | 16 176 | 16 560 | 16 342 | -1 |  |
|  |
| . . not applicable |
| - nil or rounded to zero (including null cells) |
Balance on goods and services
|  |
AUGUST KEY POINTS
TREND ESTIMATES
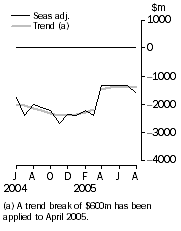
- The provisional trend estimate of the balance on goods and services was a deficit of $1,412m in August 2005, an increase of $21m on the revised deficit in July.
- Goods and services credits rose $50m to $15,030m. Goods and services debits rose $71m to $16,442m.
SEASONALLY ADJUSTED ESTIMATES
- In seasonally adjusted terms, the balance on goods and services was a deficit of $1,639m in August, an increase of $306m on the deficit in July.
- Goods and services credits fell $524m (3%) to $14,703m. Non-rural and other goods fell $474m (5%), and rural goods fell $61m (3%). Services credits rose $11m.
- Goods and services debits fell $218m (1%) to $16,342m. Intermediate and other goods fell $213m (3%), capital goods fell $40m (1%) while consumption goods rose $50m (1%). Services debits fell $15m.
ORIGINAL ESTIMATES
- In original terms, the August balance on goods and services was a deficit of $2,101m, an increase of $1,228m on the deficit in July. Goods and services credits fell $300m (2%) and goods and services debits rose $928m (6%).
- In the two months to August, exports of non-rural and other goods were up $4.3b (27%) while rural goods were down $0.5b (11%) on the corresponding period in 2004-05.
NOTES
REVISIONS
Historical revisions were made to incorporate the latest available data relating to merchandise trade, the quarterly Survey of International Trade in Services and the changes to travel and tourism related services detailed below.
In original terms, these revisions have:
- increased the deficit on goods and services for July 2005 by $487m
- decreased the deficit on goods and services for 2004-05 by $509m.
In seasonally adjusted terms, the deficit on goods and services for July 2005 decreased by $125m.
These revisions will be incorporated into the September quarter issue of Balance of Payments and International Investment Position, Australia (cat. no. 5302.0).
CHANGES IN THIS ISSUE
From this issue, the travel services credits and debits series incorporate new methodologies and data sources. Estimates for earlier periods have been recompiled to maintain consistency in the time series. There have been consequential changes to the tourism related services series as travel services are a significant contributor to these series.
Because the changes in the methodologies and data sources affected the seasonal pattern of the series, seasonal re-analysis of the affected series was undertaken.
The largest impact of the new methodologies and data sources on both travel credits and debits has been in the past five years. For 2004-05, travel credits have been revised up $1.5b from $17.6b to $19.1b, while travel debits have been revised up $1.3b from $13.5b to $14.8b.
FEATURE ARTICLES AND CHANGES TO FORTHCOMING ISSUES
Feature articles
Travel and tourism related services
A feature article, Changes to International Trade in Services Travel Statistics, detailing the changes to travel services credits and debits, has been released on the ABS web site <https://www.abs.gov.au>, concurrently with the release of this issue.
Introduction of new customs system
From 12 October 2005 all goods arriving in Australia will be recorded and monitored using Customs' Integrated Cargo System. A feature article, ABS Management of the Impact of the Implementation of the Imports Component of the New Cutoms System, which provides more information, including details of delays to ABS releases, was released on the ABS website on 16 September 2005 with the August 2005 issue of International Merchandise Imports, Australia (cat. no. 5439.0).
To access these articles on the web site select Themes then Economy then International Trade then Topics of Interest, and go to Methodological Issues.
Changes to forthcoming issues
Annual seasonal re-analysis
Seasonally adjusted and trend estimate of the balance on goods and services will be revised in the October 2005 issue of this publication as a result of the annual seasonal re-analysis.
Detailed monthly seasonal adjustment
Currently, monthly goods series are only seasonally adjusted at the broad levels shown in Table 1, while quarterly goods series are seasonally adjusted at a more detailed level in Balance of Payments and International Investment Position, Australia (cat. no. 5302.0). From the October 2005 issue of this publication, the monthly goods series will be seasonally adjusted at the same level as the quarterly series, except that other non-rural credits will not be split between beverages, sugar and other in the monthly series.
Introducing seasonal adjustment at the more detailed level will result in revisions to the seasonally adjusted and trend series. As a result of this change there should be greater alignment between the monthly and quarterly series.
Revised forward seasonal factors will be released as part of the electronic versions of the relevant publications (see 5368.0, AusStats Table 20, for monthly seasonal factors, and 5302.0, AusStats Table 95, for quarterly seasonal factors).
These changes will result in the October issue containing additional tables and expanded monthly seasonal factors in the AusStats Table 20. Details of these changes will be provided in the September issue of this publication along with prototypes which will be made available on the ABS web site.
INQUIRIES
For further information about these and related statistics, contact the National Information and Referral Service on 1300 135 070 or Tom Jebbink on Canberra (02) 6252 5540.
ANALYSIS AND COMMENTS
BALANCE ON GOODS AND SERVICES
The trend estimate of the balance on goods and services in August 2005 was a deficit of $1,412m, an increase of $21m on the deficit in July.
In seasonally adjusted terms, the balance on goods and services in August 2005 was a deficit of $1,639m, an increase of $306m on the deficit in July.
EXPORTS OF GOODS AND SERVICES
The trend estimate of goods and services credits rose $50m between July and August to $15,030m.
In seasonally adjusted terms, goods and services credits fell $524m (3%) to $14,703m. Non-rural and other goods fell $474m (5%), rural goods fell $61m (3%) while services credits rose $11m.
Exports of goods
GOODS CREDITS
Rural goods
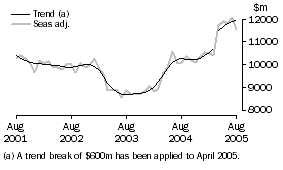
The trend estimate of rural goods exports rose $9m to $2,117m.
In seasonally adjusted terms, exports of rural goods fell $61m (3%) to $2,073m.
In original terms, exports of rural goods fell $42m (2%) to $2,050m.
Movements in the original series contributing to the fall in the seasonally adjusted series were:
- meat and meat preparations, down $82m (13%), compared with an average July to August fall of 2% over the three previous years
- wool and sheepskins, down $72m (33%), compared with an average July to August fall of 16% over the previous three years.
Partly offsetting these effects were cereal grains and cereal preparations, up $38m (12%), compared with an average July to August rise of 3% over the previous three years.
Exports of goods continued
Non-rural and other goods
The trend estimate of non-rural and other goods exports rose $34m to $9,803m.
In seasonally adjusted terms, exports of non-rural and other goods fell $474m (5%) to $9,481m.
In original terms, exports of non-rural and other goods fell $307m (3%) to $9,941m.
Movements in the original series contributing to the fall in the seasonally adjusted series were:
- other mineral fuels, down $286m (21%), in contrast to an average July to August rise of 1% over the previous three years (with crude oil volumes down 31%)
- coal, coke and briquettes, down $75m (4%), in contrast to an average July to August rise of 10% over the previous three years (on reduced volumes)
- other non-rural, down $59m (6%), in contrast to an average July to August rise of 6% over the previous three years
- metal ores and minerals, up $19m (1%), compared with an average July to August rise of 6% over the previous three years
- transport equipment, unchanged at $451m, compared with an average July to August rise of 12% over the previous three years.
Partly offsetting these effects were:
- machinery, up $74m (11%), in contrast to an average July to August fall of 3% over the previous three years
- other goods, up $63m (10%), compared with an average July to August rise of 2% over the previous three years.
Exports of services
SERVICES CREDITS
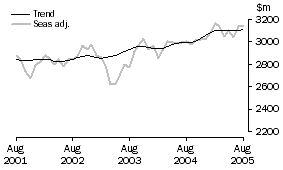
In trend terms, services credits rose $7m to $3,110m.
Seasonally adjusted, services credits rose $11m to $3,149m.
Transportation services, up $16m (2%) contributed to the rise in the seasonally adjusted series but was partly offset by other services, down $4m (1%).
Seasonally adjusted, tourism related services credits rose $12m (1%) to $2,029m.
IMPORTS OF GOODS AND SERVICES
The trend estimate of goods and services debits rose $71m between July and August to $16,442m.
In seasonally adjusted terms, goods and services debits fell $218m (1%) to $16,342m. Intermediate and other goods fell $213m (3%), capital goods fell $40m (1%) while consumption goods rose $50m (1%).
The value of goods debits in original terms is influenced by the number and composition of trading days in August 2005 compared with July 2005. To account for this difference, downward adjustments of about 6% for intermediate and other goods, about 9% for consumption goods and about 13% for capital goods have been applied prior to deriving the seasonally adjusted series.
Imports of goods
GOODS DEBITS
Consumption goods
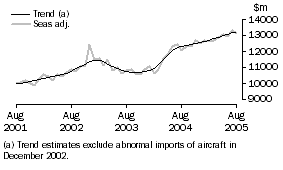
The trend estimate of imports of consumption goods rose $29m (1%) to $4,048m.
In seasonally adjusted terms, imports of consumption goods rose $50m (1%) to $4,090m.
In original terms, imports of consumption goods rose $468m (12%) to $4,489m.
The following commodity groups had the largest deviation from their three year average movement:
- consumption goods n.e.s., up $200m (16%), compared with an average July to August rise of 2% over the previous three years
- non-industrial transport equipment, down $38m (3%), compared with an average July to August fall of 17% over the previous three years
- food and beverages, up $93m (21%), compared with an average July to August rise of 3% over the previous three years
- toys, books and leisure goods, up $89m (29%), compared with an average July to August rise of 10% over the previous three years
- household electrical items, up $58m (18%), compared with an average July to August rise of 2% over the previous three years
- textiles, clothing and footwear, up $66m (13%), compared with an average July to August rise of 4% over the previous three years.
Capital goods
The trend estimate of imports of capital goods fell $24m (1%) to $2,951m.
In seasonally adjusted terms, imports of capital goods fell $40m (1%) to $2,928m.
In original terms, imports of capital goods rose $202m (7%) to $3,158m.
The following commodity groups had the largest deviation from their three year average movement:
- machinery and industrial equipment, up $123m (10%), compared with an average July to August rise of 13% over the previous three years
- capital goods n.e.s., up $45m (12%), compared with an average July to August rise of 3% over the previous three years
- industrial transport equipment n.e.s., down $7m (2%), compared with an average July to August fall of 9% over the previous three years
- telecommunications equipment, up $70m (20%), in contrast to an average July to August fall of 1% over the previous three years
- civil aircraft, down $15m (16%).
Intermediate and Other Goods
The trend estimate of imports of intermediate and other goods rose $62m (1%) to $6,201m.
In seasonally adjusted terms, intermediate and other goods imports fell $213m (3%) to $6,088m.
In original terms, imports of intermediate and other goods rose $192m (3%) to $5,721m.
The following commodity groups had the largest deviation from their three year average movement:
- fuels and lubricants, down $139m (9%), in contrast to an average July to August rise of 12% over the previous three years
- other merchandise goods, down $3m (4%), in contrast to an average July to August rise of 59% over the previous three years
- food and beverages, mainly for industry, down $9m (15%), compared with an average July to August fall of 9% over the previous three years
- other goods, up $223m (53%), compared with an average July to August rise of 5% over the previous three years
- parts for transport equipment, up $51m (9%), in contrast to an average July to August fall of 5% over the previous three years
- organic and inorganic chemicals, up $35m (11%), in contrast to an average July to August fall of 2% over the previous three years
- iron and steel, up $59m (21%), compared with an average July to August rise of 9% over the previous three years.
Imports of services
SERVICES DEBITS
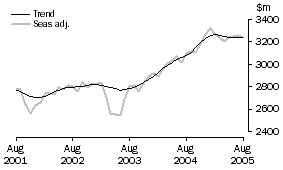
In trend terms, services debits rose $4m to $3,242m.
Seasonally adjusted, services debits fell $15m to $3,236m.
Movements in the seasonally adjusted components contributing to this fall were:
- transportation services, down $37m (3%)
- other services, down $7m (1%).
Partly offsetting these effects were travel services, up $29m (2%).
Seasonally adjusted, tourism related services debits fell $8m to $1,710m.
 Print Page
 Print All