KEY FIGURES
 | Trend estimates
| Seasonally adjusted estimates
| |
| Mar 2004 | Feb 2004 to Mar 2004 | Mar 2004 | Feb 2004 to Mar 2004 | |
| |
| Value of dwelling commitments(a) | $m | % change | $m | % change | |
| Total dwellings | 15,105 | -3.1 | 15,370 | 0.6 | |
| Owner occupied housing | 9,664 | -2.5 | 9,810 | -0.1 | |
| Investment housing - fixed loans(b) | 5,441 | -4.3 | 5,560 | 1.9 | |
| Number of dwelling commitments(a) | no. | % change | no. | % change | |
| Owner occupied housing | 50,266 | -3.2 | 50,157 | -1.2 | |
| Construction of dwellings | 5,096 | -1.9 | 5,052 | -2.1 | |
| Purchase of new dwellings | 1,783 | -3.6 | 1,756 | -3.9 | |
| Purchase of established dwellings | 43,387 | -3.3 | 43,349 | -1.0 | |
| |
| (a) Includes refinancing. |
| (b) Excludes revolving credit. |
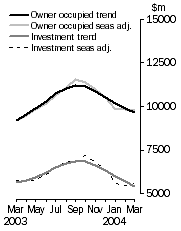
Housing finance, Value of dwellings
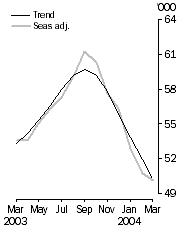
| Owner occupied housing finance, Number of dwellings
|
KEY POINTS
TREND ESTIMATES
- Total value of dwelling finance commitments decreased by 3.1% in March 2004. Decreases were recorded in both owner occupied housing (down 2.5%) and investment housing (down 4.3%).
- The number of housing finance commitments for owner occupation declined by 3.2% in March 2004, while the number excluding refinancing declined by 2.9%. The construction finance trend series recorded a decrease of 1.9% in March 2004, the seventh consecutive monthly decrease. There were also decreases in the trend series for purchase of new dwellings (down 3.6%), refinancing (down 3.8%) and the purchase of established dwellings, which fell for the sixth consecutive month (down 3.3%).
SEASONALLY ADJUSTED ESTIMATES
- Total value of housing finance commitments increased by 0.6% in March 2004. The owner occupied housing series fell by 0.1%, while investment housing commitments rose by 1.9%.
- The number of housing finance commitments for owner occupied housing decreased by 1.2% in March 2004, driven primarily by the decrease in refinancing of established dwellings (down 1.9%).
ORIGINAL ESTIMATES
- Owner occupied loans to first home buyers was 12.5% of all loans, a record low.
- The average loan value for owner-occupied housing was $197,600 in March 2004, up from the February figure of $190,600.
NOTES
CHANGES IN THIS ISSUE
This publication has been renamed Housing Finance, Australia and includes two additional tables:
- a new table on the Value of Finance Commitments for Housing. This new table is similar in content and format to table 8 (Finance Commitments for Housing) published in Lending Finance, Australia (ABS cat. no. 5671.0).
- a new table of home loan outstandings classified by lender. This new table contains monthly data from March 2002 for Authorised Deposit-taking Institutions (ADIs) classified by type of lender and split by owner occupation housing and investment housing. For other lending institutions, total housing loan outstandings is provided on a quarterly basis to provide a complete picture of all financial institutions providing finance for the purpose of housing.
The numbering of tables in this publication remains unchanged. However, some of the unpublished AusStats table numbers have been changed. All data currently available will continue to be available in the same format. Queries regarding the changes may be directed to Darren Page on 02 6252 6731 or email darren.page@abs.gov.au.
A feature article describing the changes in content and concepts in this issue starts on page 9.
INQUIRIES
For further information about these and related statistics, contact the National Information and Referral Service on 1300 135 070 or Darren Page on Canberra (02) 6252 6731.
SUMMARY COMMENTARY
HOUSING FINANCE SUMMARY OF FINDINGS
DWELLINGS FINANCED
Value of Dwelling Finance
The total value of housing commitments excluding alterations and additions (seasonally adjusted) increased by 0.6% in March 2004, after a decrease of 0.9% in February 2004. The trend series decreased by 3.1%.
The total value of owner occupied commitments (seasonally adjusted) fell for the sixth consecutive month, falling by 0.1% in March 2004. The smaller decrease in the value of commitments compared to the decline in number of commitments reflects growth in the average loan size in March. Decreases in refinancing of established dwellings (-1.6%) and purchase of new dwellings (-3.7%) were offset partially by increases in purchase of established dwellings excluding refinancing (0.8%) and construction of dwellings (0.6%). The trend series decreased by 2.5% in March 2004.
The seasonally adjusted series for value of investment housing commitments (including finance for construction and finance for rent or resale) increased by 1.9% in March 2004, after the previous four consecutive monthly decreases. This increase was primarily due to increase in purchase of dwellings for rent or resale by individuals (0.5%). The trend series fell 4.3%.
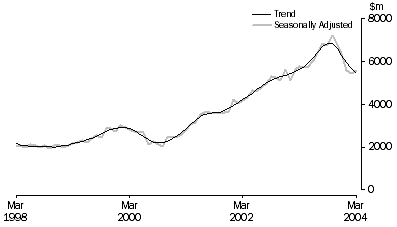
INVESTMENT HOUSING - TOTAL
Number of Owner Occupied Dwellings Financed
The seasonally adjusted housing finance series continued its recent decline, decreasing by 1.2% in March, the sixth successive monthly decrease. The decrease was mainly due to the refinancing of established dwellings (down 288, -1.9%). There were also decreases in construction of dwellings (down 108, -2.1%), purchase of established dwellings excluding refinancing (down 135, -0.5%), and purchase of new dwellings (down 72, -3.9%). The total housing finance trend fell by 3.2% in March 2004.
There were decreases (seasonally adjusted) in NSW (down 359, -2.2%), Victoria (down 191, -1.7%), SA (down 110, -2.4%), NT (down 8, -1.7%), WA (down 77, -1.1%), and Queensland (down 74, -0.7%). The only increases were Tasmania (up 57, 5.5%) and ACT (up 3, 0.5%). The trend series decreased in March 2004 for all states and territories except the NT.
In original terms, the percentage of first home buyers declined to a record low of 12.5% in March 2004, continuing the general decline since the record high of 25.8% in July 2001.
Number of Owner Occupied Dwellings Financed Excluding Refinancing
The number of dwellings financed excluding refinancing (seasonally adjusted) decreased slightly in March 2004 (down 315, -0.9%). The trend series decreased by 2.9% in March.
PURPOSE OF FINANCE (OWNER OCCUPATION)
Construction of dwellings
The seasonally adjusted number of construction commitments fell by 2.1% in March 2004, after an decrease of 3.5% in February. The trend fell 1.9% in March 2004.
Purchase of new dwellings
The number of commitments for the purchase of new dwellings (seasonally adjusted) decreased by 3.9% in March 2004, after an increase of 8.4% in February. The trend series fell 3.6% in March 2004.
Purchase of established dwellings
The seasonally adjusted established dwelling series decreased by 1.0% (down 423) in March 2004, the sixth successive month of decreasing commitments. The decrease was primarily driven by a large decrease (down 288, -1.9%) in refinancing commitments. The trend series decreased by 3.3% in March.
Refinancing
The number of refinancing commitments (seasonally adjusted) fell by 1.9% in March 2004, the third successive month of decreasing commitments. The trend series decreased by 3.8% in March.
TYPE OF LENDER (OWNER OCCUPATION)
Banks
Bank finance (seasonally adjusted) decreased for the sixth consecutive month, falling by 1.8% (down 682) in March 2004 after a decrease of 2.8% in February. The trend series fell 3.1% in March.
Non-banks
Non-bank commitments (seasonally adjusted) increased by 0.6% in March 2004, after five successive monthly decreases. There were seasonally adjusted decreases for wholesale lenders (down 0.2%) and permanent building societies (down 1.9%). The non-bank trend series decreased by 3.4%.
HOUSING LOAN OUTSTANDINGS
At the close of the month, housing loans outstanding of authorised deposit-taking institutions was $449 314m, up $2 818m (0.6%) from February's closing balance. Owner occupied housing loans increased by $1 712m (0.6%) to close at $300 525m, while investment housing loans outstanding increased by $1 106m (0.7%) to reach a closing balance of $148 789m.
Bank loans increased by $2 352m (0.6%) during March to a closing stock of $421 833m. Owner Occupied housing loans increased by $1 255m (0.5%) to $278 252m, while investment housing loans increased by $1 097m (0.8%) to $143 581m.
 Print Page
 Print All