INTERNATIONAL TRADE IN SPORTS AND PHYSICAL RECREATION PRODUCTS
International trade statistics are compiled from information supplied to Customs by exporters and importers or their agents. There are 1.2 million export transactions and 5 million import transactions recorded each year, many of which are small value records. Due to the large volume of transactions involved and the limited resources available to undertake checks, ABS editing resources are mostly focussed on editing large value records. The majority of data about international trade in sports and physical recreation products relate to small value records, which are 'as reported to Customs'. More information about the quality of international trade data are included in the ABS publication Information Paper: Ensuring International Trade Data Quality, 2008 (cat. no. 5498.0.55.001).
There are some sports and physical recreation products for which trade data are not separately available, primarily because they are parts of larger product categories predominantly out of scope of the ACLC Product Classification. Sports apparel is one example. The various items of sports apparel are not separately identified in trade statistics, but are instead included in parts of more general categories of clothing. Another example is automatic bowling alley equipment, which for the purposes of international trade, is part of the category Other articles for funfair, table or parlour games. This category is predominantly in scope of the Other leisure products part of the ACLC Product Classification and hence is excluded from data concerning international trade in sports and physical recreation products.
Australia's trade in the selected sports and physical recreation goods is in deficit. Imports of these goods during 2006-07 were valued at $2,092.5m. This is four times the $508.8m in sports and physical recreation goods which was exported during that year. The category of Boats, yachts and other vessels for pleasure or sports ($232.6m) was the main contributor to the overall export figure, followed by Horses with $141.8m. Together these categories accounted for over 70% of total exports. At $521.3m; the category of Boats, yachts and other vessels for pleasure or sports was also the main contributor to the overall import figure, followed by Gymnasium or athletics articles and equipment with $241.1m. The combined contribution of these categories to total imports was just over 35%.
The main source countries of imported sports and physical recreation goods during 2005-06 were China ($706.3m) and the United States of America (USA) ($420.2m), together accounting for over half of all imports of these goods. The USA was also the second largest market for exported sports and physical recreation goods ($95.4m), while the largest market was New Zealand ($138.5m). The combined purchases by these two countries of Australian sports and physical recreation exports accounted for close to half the total (46.0%).
Exports of sports and physical recreation goods
Sports and physical recreation goods exported from Australia during 2006-07 were valued at $508.8m, 5.3% higher than the $483.2m recorded for 2005-06.
Since 2000-01, the product categories Horses and Boats, yachts and other vessels for pleasure or sports have been the dominant contributors to the total value of sports and physical recreation goods exported. During that time, their combined contribution has always exceeded 60%. For Boats, yachts and other vessels for pleasure or sports, the value (in current prices) increased for all years except 2003-04 with the 2006-07 figure of $232.3m being over one and a half times the $144.3m recorded for 2000-01. The value of exports of Horses fluctuated over the same period with $141.8m being reported for 2006-07.
Other product categories which have made substantial contributions to total exports since 2000-01 are Other articles and equipment for sports or physical recreation, swimming pools and paddling pools and Water-skis, surf-boards, sailboards and other water sports equipment. For 2006-07, these categories contributed exports worth $25.2m and $21.8m respectively.
10.2 EXPORTS OF SELECTED SPORTS AND PHYSICAL RECREATION GOODS(a), Current prices |
|  |
| 2000-01 | 2001-02 | 2002-03 | 2003-04 | 2004-05 | 2005-06 | 2006-07 | |
| $m | $m | $m | $m | $m | $m | $m | |
| |
| Horses | 93.3 | 129.9 | 121.3 | 117.1 | 101.9 | 114.4 | 141.8 | |
| Tents | 1.3 | 1.6 | 1.7 | 0.9 | 1.7 | 1.8 | 1.4 | |
| Sleeping bags | 0.1 | 0.1 | 0.2 | 0.2 | 0.4 | 0.5 | 0.6 | |
| Other camping goods of textile fabric | 0.8 | 1.3 | 1.0 | 1.3 | 1.4 | 1.6 | 1.2 | |
| Parachutes | 0.1 | 0.2 | 0.6 | 1.3 | 0.5 | 0.2 | 0.5 | |
| Track suits | 0.3 | 0.1 | 0.3 | 0.1 | 0.3 | - | 0.1 | |
| Ski suits | 0.1 | 0.2 | - | 0.2 | 0.1 | - | 0.3 | |
| Swimwear for men and boys | 1.5 | 1.8 | 1.8 | 1.5 | 2.1 | 1.1 | 1.0 | |
| Swimwear for women and girls | 6.3 | 5.3 | 7.3 | 9.7 | 12.9 | 10.6 | 11.7 | |
| Saddlery and harness, for any animal, of any material | 6.0 | 8.3 | 7.6 | 7.1 | 7.1 | 5.9 | 6.4 | |
| Sports or physical recreation footwear | 8.1 | 8.3 | 9.1 | 7.7 | 6.0 | 8.3 | 5.8 | |
| Snow skis, other snow ski equipment, ice skates and rollerskates | 1.8 | 4.1 | 3.1 | 3.3 | 2.2 | 0.9 | 0.5 | |
| Waterskis, surfboards, sailboards and other water sports equipment | 23.2 | 25.4 | 19.0 | 19.6 | 21.2 | 21.7 | 21.8 | |
| Gymnasium or athletics articles and equipment | 10.2 | 13.2 | 13.6 | 11.2 | 10.0 | 9.6 | 12.1 | |
| Gloves, mittens and mitts of leather or composition leather, designed for use in sports | 0.2 | 0.1 | 0.4 | 0.2 | 0.2 | 0.4 | 0.4 | |
| Golf clubs and other golf equipment | 40.9 | 27.6 | 41.5 | 18.0 | 7.7 | 12.1 | 11.4 | |
| Tennis, badminton and similar racquets | 0.1 | 0.1 | 0.2 | 0.6 | 1.2 | 0.7 | 1.1 | |
| Sports balls | 3.0 | 3.9 | 4.3 | 3.7 | 2.6 | 4.4 | 3.5 | |
| Fishing rods and other line fishing tackle; fish landing nets, butterfly and similar nets; decoy 'birds' and similar hunting or shooting requisites | 4.8 | 6.0 | 4.3 | 4.9 | 4.9 | 5.7 | 5.7 | |
| Billiard articles and accessories | 0.9 | 0.9 | 0.6 | 0.5 | 0.6 | 0.6 | 0.4 | |
| Sporting, hunting or target-shooting shotguns and rifles | 0.9 | 1.8 | 0.6 | 0.5 | 0.6 | 0.6 | 0.4 | |
| Articles and equipment for table-tennis | 0.1 | 0.1 | 0.1 | 0.2 | 0.1 | - | 0.1 | |
| Other articles and equipment for sports or physical recreation; swimming pools and paddling pools | 10.7 | 15.6 | 19.3 | 19.9 | 22.4 | 22.2 | 25.2 | |
| Snowmobiles; and golf cars and similar vehicles | 3.9 | 2.7 | 2.3 | 2.0 | 1.1 | 2.1 | 2.4 | |
| Bicycles and other cycles, not motorised | 1.6 | 2.4 | 3.0 | 3.2 | 3.2 | 3.3 | 3.3 | |
| Boats, yachts and other vessels for pleasure or sports | 144.3 | 185.6 | 186.8 | 123.3 | 199.9 | 230.3 | 232.6 | |
| Inflatable craft for pleasure or sports | 0.6 | 0.5 | 1.5 | 0.8 | 1.9 | 0.8 | 1.2 | |
| Sails | 2.3 | 3.3 | 2.9 | 4.2 | 3.5 | 3.3 | 1.8 | |
| Spark-ignition marine outboard motors | 8.5 | 8.2 | 13.5 | 14.0 | 15.3 | 17.2 | 11.7 | |
| Gliders and hang gliders | 3.8 | 4.2 | 3.7 | 1.8 | 1.2 | 0.4 | 0.3 | |
| Balloons and dirigibles and other non-powered aircraft | 0.9 | 0.5 | 0.8 | 0.5 | 0.3 | 0.6 | 0.2 | |
| Total | 380.7 | 463.4 | 473.9 | 381.8 | 436.6 | 483.2 | 508.8 | |
| |
| - nil or rounded to zero (including null cells) |
| (a) All data are presented in Australian dollars using 'Free on Board' valuations. |
| Source: International Trade, Australia: FASTRACCS SERVICE-Electronic Delivery, 2008 (cat.no. 5466.0). |
Destination of exports
Throughout the period 2000-01 to 2006-07, New Zealand and the USA have been the major destinations for sports and physical recreation goods exported from Australia. For 2006-07, the value of exports to New Zealand was higher at $138.5m compared with $95.4m to the USA. Exports to the USA were valued at over double the $39.0m worth of goods exported to Hong Kong (SAR of China) which was the third-placed export destination.
The value (in current prices) of exports of sports and physical recreation goods to individual countries has varied over time. Exports to Italy increased to $23.0m in 2005-06 and decreased to $19.7m in 2006-07 after averaging $8.2m for the previous four years. Exports to South Africa averaged $5.7m from 2000-01 to 2004-05, rose to $14.0m in 2005-06 and continued to rise to $20.2m in 2006-07. Exports to Singapore almost doubled to $24.5m in 2006-07 from $12.8m in 2005-06 and exports to Spain rose to $12.6m in 2004-05, but decreased to $4.7m in 2005-06 and then increased to $16.2m in 2006-07.
These fluctuations in the value of exports of sports and physical recreation goods may be a result of relatively large value items e.g. Boats and Horses included in the data. Relatively small fluctuations in the volume of exports of these goods can have a relatively large impact on the value of exports to an individual country.
10.3 EXPORTS OF SELECTED SPORTS AND PHYSICAL RECREATION GOODS(a), Current prices - By destination |
| |
| 2000-01 | 2001-02 | 2002-03 | 2003-04 | 2004-05 | 2005-06 | 2006-07 | |
| Country of origin | $m | $m | $m | $m | $m | $m | $m | |
| |
| New Zealand | 75.6 | 94.7 | 106.8 | 94.7 | 108.8 | 126.9 | 138.5 | |
| United States of America | 90.6 | 95.5 | 96.7 | 63.2 | 95.4 | 105.4 | 95.4 | |
| Hong Kong (SAR of China) | 31.3 | 43.2 | 39.5 | 34.9 | 29.2 | 35.3 | 39.0 | |
| Singapore | 16.8 | 10.5 | 14.4 | 9.7 | 7.9 | 12.8 | 24.5 | |
| United Kingdom | 11.7 | 21.3 | 19.2 | 37.3 | 14.1 | 14.0 | 24.2 | |
| South Africa | 4.4 | 4.8 | 5.6 | 4.8 | 8.8 | 14.0 | 20.2 | |
| Italy | 5.0 | 6.6 | 10.9 | 10.1 | 22.6 | 23.0 | 19.7 | |
| Japan | 26.1 | 26.1 | 22.9 | 14.7 | 17.8 | 16.8 | 19.6 | |
| Spain | 4.8 | 6.2 | 6.3 | 4.1 | 12.6 | 4.7 | 16.2 | |
| United Arab Emirates | 2.6 | 6.9 | 7.4 | 4.7 | 7.5 | 9.0 | 12.2 | |
| Korea, Republic of | 2.2 | 5.3 | 2.3 | 4.4 | 7.5 | 8.1 | 9.0 | |
| New Caledonia | 3.9 | 5.6 | 7.4 | 12.1 | 7.9 | 11.8 | 7.8 | |
| Malaysia | 6.0 | 19.8 | 7.1 | 4.5 | 3.8 | 4.8 | 6.1 | |
| Fiji | 1.8 | 3.2 | 2.4 | 4.6 | 3.1 | 3.5 | 5.6 | |
| Germany | 5.9 | 4.0 | 26.0 | 3.4 | 6.0 | 2.6 | 5.6 | |
| Canada | 1.3 | 2.6 | 1.9 | 1.5 | 4.7 | 4.8 | 5.4 | |
| France | 3.7 | 2.8 | 4.4 | 3.8 | 7.6 | 4.2 | 4.8 | |
| Papua New Guinea | 2.9 | 2.6 | 3.9 | 6.7 | 5.0 | 6.4 | 4.5 | |
| China | 10.6 | 2.9 | 3.1 | 3.5 | 4.3 | 5.5 | 3.6 | |
| Netherlands | 3.2 | 2.4 | 4.6 | 3.1 | 3.5 | 6.5 | 3.6 | |
| Other countries | 70.2 | 96.3 | 77.9 | 57.7 | 57.9 | 76.2 | 43.3 | |
| Total | 380.7 | 463.4 | 473.9 | 381.8 | 436.6 | 483.2 | 508.8 | |
| |
| (a) All data are presented in Australian dollars using 'Free on Board' valuations. |
| Source: International Trade, Australia: FASTRACCS Service-Electronic Delivery, 2008 (cat. no. 5466.0). |
Imports of sports and physical recreation goods
The value (in current prices) of sports and physical recreation goods imported into Australia during 2006-07 was $2,092.5m. This was 8.7% higher than the $1,925.8m recorded in 2005-06.
Boats, yachts and other vessels for pleasure or sports and Gymnasium or athletics articles and equipment were the product categories which contributed most to the value of imports of sports and physical recreation goods in 2006-07. These two categories were also in the top four in terms of value of goods imported for the previous two years. Other categories in the top five for 2006-07 were Spark-ignition marine outboard motors ($186.3m); Sports or physical recreation footwear ($175.7m); and Bicycles and other cycles, not motorised ($174.9m).
Together, these five sports and physical recreation product categories accounted for 62.1% ($1,299.3m) of total imports of sports and physical recreation goods in 2006-07 and not less than 53% of the total in any other year since 2000-01.
10.4 IMPORTS OF SELECTED SPORTS AND PHYSICAL RECREATION GOODS(a), Current prices |
| |
| 2000-01 | 2001-02 | 2002-03 | 2003-04 | 2004-05 | 2005-06 | 2006-07 | |
| $m | $m | $m | $m | $m | $m | $m | |
| |
| Horses | 60.1 | 71.3 | 92.5 | 66.2 | 84.2 | 108.2 | 130.3 | |
| Tents | 35.8 | 36.7 | 34.6 | 32.4 | 43.7 | 52.9 | 56.4 | |
| Sleeping bags | 13.4 | 11.1 | 13.0 | 14.1 | 12.4 | 12.8 | 13.5 | |
| Other camping goods of textile fabric | 6.7 | 8.9 | 6.9 | 7.0 | 7.7 | 9.4 | 7.7 | |
| Parachutes | 5.2 | 3.1 | 5.9 | 4.5 | 4.5 | 5.0 | 3.7 | |
| Track suits | 6.8 | 3.5 | 3.6 | 3.7 | 3.2 | 3.0 | 2.2 | |
| Ski suits | 0.4 | 0.2 | 0.2 | 0.2 | 0.3 | 0.6 | 0.8 | |
| Swimwear for men and boys | 3.8 | 7.2 | 7.7 | 8.4 | 14.2 | 14.1 | 15.8 | |
| Swimwear for women and girls | 21.3 | 28.1 | 33.8 | 30.6 | 38.3 | 42.4 | 46.1 | |
| Saddlery and harness, for any animal, of any material | 18.9 | 22.3 | 23.6 | 24.6 | 30.5 | 30.1 | 38.5 | |
| Sports or physical recreation footwear | 146.3 | 166.0 | 187.1 | 148.0 | 159.7 | 155.8 | 175.7 | |
| Snow skis, other snow ski equipment, ice skates and rollerskates | 20.2 | 15.1 | 18.1 | 15.8 | 16.7 | 15.3 | 13.6 | |
| Waterskis, surfboards, sailboards and other water sports equipment | 28.0 | 32.0 | 33.0 | 35.1 | 42.2 | 47.2 | 50.3 | |
| Gymnasium or athletics articles and equipment | 69.8 | 84.6 | 100.6 | 111.4 | 155.1 | 203.5 | 241.1 | |
| Gloves, mittens and mitts of leather or composition leather, designed for use in sports | 10.1 | 10.7 | 12.2 | 10.8 | 10.7 | 11.3 | 12.4 | |
| Golf clubs and other golf equipment | 92.4 | 98.1 | 99.5 | 84.0 | 92.4 | 90.9 | 91.1 | |
| Tennis, badminton and similar racquets | 13.8 | 14.2 | 14.6 | 10.2 | 9.4 | 12.3 | 12.0 | |
| Sports balls | 27.1 | 31.0 | 36.3 | 28.8 | 31.2 | 36.7 | 21.7 | |
| Fishing rods and other line fishing tackle; fish landing nets, butterfly and similar nets; decoy 'birds' and similar hunting or shooting requisites | 58.4 | 65.2 | 58.8 | 57.2 | 59.8 | 68.8 | 78.4 | |
| Billiard articles and accessories | 5.2 | 5.6 | 6.1 | 5.9 | 6.9 | 8.2 | 9.4 | |
| Sporting, hunting or target-shooting shotguns and rifles | 10.2 | 12.0 | 15.9 | 14.2 | 17.1 | 18.6 | 36.5 | |
| Articles and equipment for table-tennis | 1.7 | 2.0 | 2.3 | 2.5 | 3.1 | 4.2 | 4.6 | |
| Other articles and equipment for sports or physical recreation; swimming pools and paddling pools | 130.1 | 65.7 | 67.3 | 64.8 | 74.3 | 85.2 | 109.8 | |
| Snowmobiles; and golf cars and similar vehicles | 14.5 | 13.2 | 13.8 | 13.8 | 21.7 | 21.8 | 19.0 | |
| Bicycles and other cycles, not motorised | 123.4 | 116.4 | 130.8 | 111.4 | 149.9 | 163.6 | 174.9 | |
| Boats, yachts and other vessels for pleasure or sports | 199.2 | 140.1 | 137.5 | 223.1 | 373.6 | 474.6 | 521.3 | |
| Inflatable craft for pleasure or sports | 6.0 | 6.3 | 9.0 | 7.0 | 8.7 | 9.2 | 11.0 | |
| Sails | 2.6 | 2.7 | 3.7 | 4.8 | 4.4 | 4.6 | 3.4 | |
| Spark-ignition marine outboard motors | 140.0 | 156.2 | 174.5 | 172.5 | 182.4 | 208.2 | 186.3 | |
| Gliders and hang gliders | 1.3 | 1.5 | 1.9 | 0.9 | 0.8 | 1.6 | 0.7 | |
| Balloons and dirigibles and other non-powered aircraft | 2.5 | 2.9 | 3.9 | 3.2 | 3.3 | 5.5 | 4.3 | |
| Total | 1 275.2 | 1 233.9 | 1 349.0 | 1 317.2 | 1 662.5 | 1 925.8 | 2 092.5 | |
| |
| (a) All data are presented in Australian dollars using the Australian Customs Value. |
| Source: International Trade, Australia: FASTRACCS Service-Electronic Delivery, 2008 (cat. no. 5466.0). |
Origin of imports
Throughout the period 2000-01 to 2006-07, China and the USA have been the major sources of sports and physical recreation goods imported into Australia. For 2006-07, the combined imports from these two countries amounted to $1,126.5m, which was over half the total of all imports of these goods. China was the largest contributor to this figure and provided imports worth $706.3m. The $420.2m contributed to the total figure by the USA placed it second as a source of Australia's imports. This amount was almost two and a half times the $169.4m worth of goods imported from Taiwan which was the third-placed import source. Following Taiwan were Japan, which provided imports worth $132.7m in 2006-07; the United Kingdom with $126.4m; and New Zealand with $112.0m.
These countries were the top six sources of imports for every year of the period 2000-01 to 2006-07. Together they provided between 79% and 82% of Australia's imports of sports and physical recreation goods in each year in this period.
At current prices, imports both from China and the USA have increased by more than $300m and $100m respectively over the seven-year period from 2000-01. Imports from China nearly doubled from $388.5m in 2000-01 to $706.3m in 2006-07, while imports from the USA increased by more than 50% during this period ($282.3m to $420.2m). The value of imports from the United Kingdom also more than doubled over this period - from $46.7m in 2000-01 to $126.4m in 2006-07.
10.5 IMPORTS OF SELECTED SPORTS AND PHYSICAL RECREATION GOODS(a), Current Prices - By origin |
| |
| 2000-01 | 2001-02 | 2002-03 | 2003-04 | 2004-05 | 2005-06 | 2006-07 | |
| Country of origin | $m | $m | $m | $m | $m | $m | $m | |
| |
| China | 388.5 | 373.4 | 447.6 | 407.4 | 502.9 | 585.3 | 706.3 | |
| United States of America | 282.3 | 266.2 | 261.6 | 274.4 | 381.6 | 473.0 | 420.2 | |
| Taiwan | 120.0 | 103.7 | 105.3 | 96.5 | 136.5 | 156.9 | 169.4 | |
| Japan | 96.5 | 115.4 | 140.8 | 129.1 | 145.6 | 161.5 | 132.7 | |
| United Kingdom | 46.7 | 38.3 | 63.5 | 65.3 | 78.5 | 102.6 | 126.4 | |
| New Zealand | 83.2 | 79.7 | 71.7 | 78.9 | 97.6 | 96.1 | 112.0 | |
| Italy | 35.2 | 24.2 | 24.5 | 27.0 | 29.5 | 36.5 | 52.7 | |
| Canada | 18.9 | 16.0 | 15.6 | 18.1 | 22.7 | 29.6 | 50.9 | |
| France | 25.4 | 23.5 | 25.5 | 28.1 | 34.7 | 34.5 | 47.8 | |
| India | 18.7 | 21.2 | 24.0 | 26.2 | 28.5 | 28.8 | 34.7 | |
| Viet Nam | 22.4 | 28.8 | 25.4 | 20.2 | 25.6 | 24.8 | 31.8 | |
| Thailand | 10.5 | 13.7 | 14.6 | 13.3 | 16.5 | 21.0 | 20.6 | |
| Hong Kong (SAR of China) | 18.9 | 23.1 | 17.0 | 15.5 | 18.5 | 19.9 | 20.5 | |
| Germany | 11.9 | 12.3 | 15.8 | 15.0 | 16.2 | 18.4 | 21.9 | |
| Malaysia | 8.9 | 9.3 | 9.5 | 9.6 | 10.5 | 10.9 | 12.7 | |
| Indonesia | 19.3 | 14.2 | 15.2 | 12.8 | 11.9 | 11.8 | 11.4 | |
| Korea, Republic of | 13.3 | 11.4 | 8.7 | 5.9 | 7.0 | 8.3 | 7.6 | |
| Pakistan | 4.5 | 5.8 | 6.5 | 5.6 | 5.5 | 7.2 | 7.1 | |
| Singapore | 6.1 | 4.2 | 4.1 | 6.2 | 9.2 | 9.4 | 5.7 | |
| Denmark | 3.4 | 3.5 | 1.8 | 2.5 | 2.9 | 5.4 | 2.8 | |
| Other countries | 40.8 | 46.2 | 50.1 | 59.9 | 80.6 | 83.9 | 97.2 | |
| Total | 1 275.2 | 1 233.9 | 1 349.0 | 1 317.2 | 1 662.5 | 1 925.8 | 2 092.5 | |
| |
| (a) All data are presented in Australian dollars using the Australian Customs Value. |
| Source: International Trade, Australia: FASTRACCS Service-Electronic Delivery, 2008 (cat. no. 5466.0). |
Balance of trade in sports and physical recreation goods
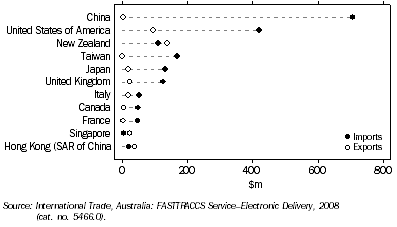
The countries shown in Graph 10.6 were Australia's major trading partners in sports and physical recreation goods for 2006-07. That is, they were the countries with which total transactions (exports and imports) were greatest. Australia had a trade deficit with most of these countries in 2006-07 for sports and physical recreation goods. The largest trade deficit was with China ($702.7m), followed by the USA ($324.8m), Taiwan ($168.8m) and Japan ($113.1m). Australia's largest trade surplus in sports and physical recreation goods was with New Zealand ($26.5m), while Singapore and Hong Kong (SAR of China) were the only other major trading partners with which Australia had a trade surplus ($18.8m and $18.5m respectively).
10.6 Balance of trade in selected sports and physical recreation goods - 2006-07
 Print Page
 Print All