 CHILDREN'S PARTICIPATION IN ORGANISED SPORT AND DANCING
INTRODUCTION
Participating in organised physical activities is an important element of a child’s social development. In recent years, increasing awareness of the incidence of childhood obesity has highlighted the desirability, on health grounds, for children to participate in regular physical activity. Participation in organised sport and/or dancing, as a subset of broader physical activity, is also important for the development of motor coordination skills, teamwork and physical fitness.
This article focuses on children's participation in organised sport and selected leisure activities including dancing. Dancing has been included in this article because it is a popular organised physical activity for girls. Data is presented from the 2009 survey of Children’s Participation in Cultural and Leisure Activities conducted throughout Australia as part of the Australian Bureau of Statistics' Monthly Population Survey. The survey collected information on participation of children aged 5 to 14 years in selected organised sports outside of school hours during the 12 months prior to interview, and on participation in selected leisure activities outside of school hours during the most recent two school weeks prior to interview.
SEX AND AGE
In 2009, over two-thirds (1.9 million or 69%) of children participated in at least one organised sport (including dancing) outside of school hours during the 12 months prior to interview which had been organised by a school, club or association. Participation rates in organised sports were higher for boys compared with girls (70% and 67% respectively), with the greatest difference being in the age group 12 to 14 years (75% and 64% respectively). For the other age groups, participation rates were similar. Overall, children aged 9 to 11 years had the highest participation rate (73%) followed by children aged 12 to 14 years (69%) and children aged 5 to 8 years (65%).
Children participating in organised sport and/or dancing(a), By age and sex - 2009 |
|
 | NUMBER ('000) | PARTICIPATION RATE (%) |
| Age group (years) | Males | Females | Persons | Males | Females | Persons |
|
| 5-8 | 355.5 | 335.9 | 691.5 | 65.1 | 64.7 | 64.9 |
| 9-11 | 307.3 | 291.1 | 598.4 | 73.2 | 72.8 | 73.0 |
| 12-14 | 320.5 | 260.8 | 581.3 | 74.7 | 64.0 | 69.4 |
| Total | 983.3 | 887.9 | 1 871.2 | 70.4 | 66.9 | 68.7 |
|
| (a) Children aged 5 to 14 years who participated in organised sport and/or organised dancing outside of school hours during the 12 months prior to interview in April 2009. |
| Source: Children's Participation in Cultural and Leisure Activities, Australia, April 2009 (cat. no. 4901.0). |
STATE AND TERRITORY
Participation rates in organised sport varied between the states and territories, ranging from 61% in Tasmania to 74% in the Australian Capital Territory. States and territories also showed differences in the participation rates between boys and girls. The Northern Territory showed a difference of 13 percentage points, with boys having a participation rate of 71% compared with 57% of girls.
Children participating in organised sport and/or dancing(a), By state and sex - 2009 |
|
| NUMBER ('000) | PARTICIPATION RATE (%) |
| State or territory of usual residence | Males | Females | Persons | Males | Females | Persons |
|
| New South Wales | 324.8 | 275.1 | 599.9 | 71.5 | 63.5 | 67.6 |
| Victoria | 247.6 | 228.2 | 475.8 | 73.0 | 70.9 | 72.0 |
| Queensland | 192.4 | 181.8 | 374.2 | 65.9 | 65.3 | 65.6 |
| South Australia | 68.7 | 68.1 | 136.8 | 69.7 | 72.2 | 70.9 |
| Western Australia | 105.7 | 92.9 | 198.6 | 73.2 | 68.7 | 71.0 |
| Tasmania | 19.9 | 19.2 | 39.2 | 60.5 | 61.8 | 61.1 |
| Northern Territory(b) | 9.0 | 6.7 | 15.7 | 70.5 | 57.1 | 64.1 |
| Australian Capital Territory | 15.2 | 15.8 | 30.9 | 71.5 | 76.5 | 74.0 |
| Australia | 983.3 | 887.9 | 1 871.2 | 70.4 | 66.9 | 68.7 |
|
| (a) Children aged 5 to 14 years who participated in organised sport and/or organised dancing outside of school hours during the 12 months prior to interview in April 2009. |
| (b) Refers to mainly urban areas only. For further information see page 32 of the publication. |
| Source: Children's Participation in Cultural and Leisure Activities, Australia, April 2009 (cat. no. 4901.0). |
MOST POPULAR ORGANISED SPORT
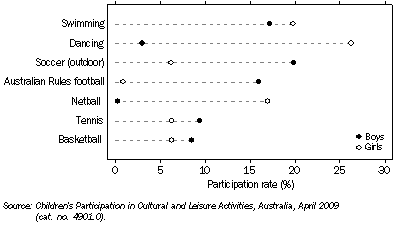
In 2009, the most popular sport for children was swimming with a participation rate of 19%, followed by dancing (14%) and soccer (outdoor) (13%). The most popular sport for boys was soccer (outdoor) (20%), followed by swimming (17%) and Australian Rules football (16%). Dancing (26%) was the most popular physical activity for girls followed by swimming (20%) and netball (17%).
Participation in most popular organised sports and dancing, By sex
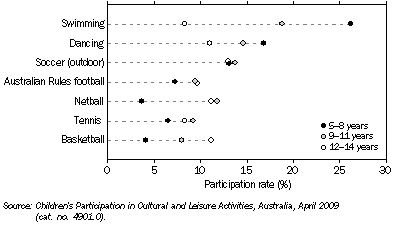
Swimming (26%) was the most popular sport among children aged 5 to 8 years, however, this decreased for the 9 to 11 years (19%) and 12 to 14 years (8.3%) age groups. For children aged 9 to 11 years, swimming (19%) was the most popular sport followed by dancing (15%) and soccer (outdoor) (14%). The participation rate for basketball increased throughout the age groups (5-8 years, 4.1%; 9-11 years, 8.0% and 12-14 years, 11.1%).
Soccer (outdoor) was the most popular sport for children aged 12 to 14 years with a participation rate of 13% followed by dancing, netball and basketball (all 11%).
Participation in most popular organised sports and dancing, By age
FREQUENCY AND DURATION IN ORGANISED SPORT
For the 1.7 million children who participated in organised sport (excluding dancing), it is estimated that they participated in sport outside school hours on average 70 times in the 12 months prior to interview. Looking at the distribution in the frequency of participation, there were relatively few infrequent participants (1 to 26 times in the 12 month period), with most children who participated doing so more than 27 times in the 12 month period.
For children aged 5 to 8 years and 9 to 11 years who participated in organised sport, the majority participated 27 to 52 times in the 12 months prior to interview (35% and 32% respectively). For children aged 12 to 14 years who participated, the majority participated 53 to 104 times in the 12 month period (31%). Participating 53 to 104 times in the 12 month period had the highest proportion of boys (31%) and participating 27 to 52 times had the highest proportion of girls (33%).
Children participating in organised sport(a), Frequency in the last 12 months(b) - By age and sex - 2009 |
|
| | NUMBER ('000) | PROPORTION (%) |
| | 5-8 years | 9-11 years | 12-14 years | Total | 5-8 years | 9-11 years | 12-14 years | Total |
|
| Males | | | | | | | | |
| 1-13 times | 55.3 | 27.1 | 26.9 | 109.2 | 15.8 | 9.0 | 8.4 | 11.3 |
| 14-26 times | 54.6 | 24.7 | 21.4 | 100.7 | 15.6 | 8.2 | 6.7 | 10.4 |
| 27-52 times | 115.4 | 90.5 | 78.5 | 284.4 | 33.0 | 29.9 | 24.7 | 29.3 |
| 53-104 times | 95.9 | 96.3 | 104.1 | 296.3 | 27.4 | 31.8 | 32.7 | 30.5 |
| 105 times or more | 28.3 | 64.2 | 87.7 | 180.2 | 8.1 | 21.2 | 27.5 | 18.6 |
| Total participants | 349.5 | 302.8 | 318.6 | 970.8 | 100.0 | 100.0 | 100.0 | 100.0 |
| Females | | | | | | | | |
| 1-13 times | 51.4 | 28.7 | 21.2 | 101.3 | 19.4 | 11.1 | 9.4 | 13.6 |
| 14-26 times | 34.4 | 30.4 | 19.7 | 84.4 | 13.0 | 11.8 | 8.8 | 11.3 |
| 27-52 times | 99.4 | 86.3 | 61.3 | 247.1 | 37.5 | 33.4 | 27.4 | 33.1 |
| 53-104 times | 58.0 | 63.7 | 65.4 | 187.1 | 21.9 | 24.7 | 29.2 | 25.0 |
| 105 times or more | 21.7 | 49.0 | 56.4 | 127.0 | 8.2 | 19.0 | 25.2 | 17.0 |
| Total participants | 264.8 | 258.1 | 224.0 | 746.9 | 100.0 | 100.0 | 100.0 | 100.0 |
| Persons | | | | | | | | |
| 1-13 times | 106.6 | 55.8 | 48.0 | 210.5 | 17.4 | 10.0 | 8.9 | 12.3 |
| 14-26 times | 89.0 | 55.1 | 41.1 | 185.1 | 14.5 | 9.8 | 7.6 | 10.8 |
| 27-52 times | 214.8 | 176.8 | 139.9 | 531.5 | 35.0 | 31.5 | 25.8 | 30.9 |
| 53-104 times | 153.9 | 160.0 | 169.6 | 483.4 | 25.0 | 28.5 | 31.3 | 28.1 |
| 105 times or more | 50.0 | 113.3 | 144.1 | 307.3 | 8.1 | 20.2 | 26.5 | 17.9 |
| Total participants | 614.2 | 560.9 | 542.6 | 1 717.8 | 100.0 | 100.0 | 100.0 | 100.0 |
|
| (a) Children aged 5 to 14 years who participated in organised sport (excluding dancing) outside of school hours during the 12 months prior to interview in April 2009. |
| (b) The total number of times children participated in organised sport (including training or practice sessions) outside of school hours for up to three sports per child during the 12 months prior to interview in April 2009. |
| Source: Children's Participation in Cultural and Leisure Activities, Australia, April 2009 (cat. no. 4901.0). |
For the children who participated in sport, it is estimated that outside of school hours, an average of 5 hours was spent playing and training in the school fortnight prior to interview. The average number of hours of participation increased with age: 5 to 8 year olds participated in sport for an average of 4 hours, compared with 12 to 14 year olds who participated for an average of 7 hours.
The highest proportion of children participated in organised sport for periods of 2 hours or less with 38% of boys and 45% of girls recording participation of this duration. The proportion of children participating in organised sport for periods of 2 hours or less decreased from 53% for children aged 5 to 8 years to 30% for children aged 12 to 14 years. The proportion of children participating for 5-9 hours per week increased from 17% of children aged 5 to 8 years to 29% of children aged 12 to 14 years. Children aged 12 to 14 years (17%) had a higher proportion of participation for 10-19 hours when compared with children aged 9 to 11 years (9.5%) and 5 to 8 years (4.4%).
Children participating in organised sport(a), Duration in last two weeks of school(b) - By age and sex - 2009 |
|
| | NUMBER ('000) | PROPORTION (%) |
| | 5-8 years | 9-11 years | 12-14 years | Total | 5-8 years | 9-11 years | 12-14 years | Total |
|
| Males | | | | | | | | |
| 2 hours or less | 173.8 | 103.0 | 87.4 | 364.2 | 49.7 | 34.0 | 27.4 | 37.5 |
| 3-4 hours | 82.9 | 63.4 | 56.0 | 202.4 | 23.7 | 20.9 | 17.6 | 20.8 |
| 5-9 hours | 68.5 | 91.6 | 97.0 | 257.1 | 19.6 | 30.3 | 30.4 | 26.5 |
| 10-19 hours | 15.0 | 35.4 | 60.9 | 111.3 | 4.3 | 11.7 | 19.1 | 11.5 |
| 20 hours or more | 9.1 | *9.4 | 17.3 | 35.8 | 2.6 | *3.1 | 5.4 | 3.7 |
| Total participants | 349.5 | 302.8 | 318.6 | 970.8 | 100.0 | 100.0 | 100.0 | 100.0 |
| Females | | | | | | | | |
| 2 hours or less | 150.7 | 109.3 | 76.9 | 336.9 | 56.9 | 42.4 | 34.3 | 45.1 |
| 3-4 hours | 60.8 | 60.6 | 41.7 | 163.1 | 23.0 | 23.5 | 18.6 | 21.8 |
| 5-9 hours | 35.3 | 53.4 | 59.6 | 148.2 | 13.3 | 20.7 | 26.6 | 19.8 |
| 10-19 hours | 11.8 | 18.2 | 33.3 | 63.3 | 4.5 | 7.0 | 14.8 | 8.5 |
| 20 hours or more | *6.1 | 16.6 | 12.6 | 35.4 | *2.3 | 6.4 | 5.6 | 4.7 |
| Total participants | 264.8 | 258.1 | 224.0 | 746.9 | 100.0 | 100.0 | 100.0 | 100.0 |
| Persons | | | | | | | | |
| 2 hours or less | 324.5 | 212.4 | 164.2 | 701.1 | 52.8 | 37.9 | 30.3 | 40.8 |
| 3-4 hours | 143.8 | 124.0 | 97.7 | 365.5 | 23.4 | 22.1 | 18.0 | 21.3 |
| 5-9 hours | 103.8 | 145.0 | 156.6 | 405.4 | 16.9 | 25.8 | 28.9 | 23.6 |
| 10-19 hours | 26.8 | 53.5 | 94.2 | 174.6 | 4.4 | 9.5 | 17.4 | 10.2 |
| 20 hours or more | 15.2 | 26.0 | 29.9 | 71.2 | 2.5 | 4.6 | 5.5 | 4.1 |
| Total participants | 614.2 | 560.9 | 542.6 | 1 717.8 | 100.0 | 100.0 | 100.0 | 100.0 |
|
| (a) Children aged 5 to 14 years who participated in organised sport (excluding dancing) outside of school hours during the 12 months prior to interview in April 2009. |
| (b) The total number of hours children participated in organised sport (including training or practise sessions) outside of school hours for up to three sports per child during the two school weeks prior to interview in April 2009. |
| Source: Children's Participation in Cultural and Leisure Activities, Australia, April 2009 (cat. no. 4901.0). |
SELECTED OTHER ACTIVITIES
Information on children's participation in a range of other selected activities in the previous two weeks (outside of school hours) was also collected. During that two week period the selected activities with the highest participation rates were:
- 97% (2.7 million) of children had watched television, DVDs or videos
- 83% (2.3 million) of children had spent time on other screen-based activities, such as using the computer or Internet, playing games on a games console or mobile phone, and creating music playlists or viewing photos on an MP3 player
- 82% (2.2 million) of children had done homework or other study.
The participation rates for selected other activities varied across the different age groups. Children's participation in skateboarding, rollerblading or riding a scooter was higher for 5 to 8 year olds (59%) and decreased to 32% for 12 to 14 year olds. Bike riding also decreased in the higher age groups (69% for 5 to 8 years olds to 48% for 12 to 14 year olds). Children's participation in art and craft had the largest decrease with age. Nearly two-thirds (65%) of children aged 5 to 8 years participated in art and crafts while the participation rate fell to 29% for children aged 12 to 14 years. In contrast, children's participation in other screen-based activities increased from 74% for children aged 5 to 8 years to 90% for children aged 12 to 14 years. Children's participation in homework or other study increased from 73% for children aged 5 to 8 years to 89% for children aged 12 to 14 years.
Children participating in selected other activities(a), By age - 2009 |
|
| NUMBER ('000) | PARTICIPATION RATE (%) |
| 5-8 years | 9-11 years | 12-14 years | Total | 5-8 years | 9-11 years | 12-14 years | Total |
|
| Skateboarding, rollerblading or riding a scooter | 627.8 | 446.6 | 268.2 | 1 342.6 | 58.9 | 54.5 | 32.0 | 49.3 |
| Bike riding | 732.4 | 507.2 | 404.0 | 1 643.6 | 68.7 | 61.9 | 48.3 | 60.4 |
| Watching TV, DVDs or videos | 1 031.6 | 802.0 | 816.8 | 2 650.4 | 96.8 | 97.8 | 97.6 | 97.4 |
| Other screen-based activities(b) | 786.9 | 722.6 | 754.5 | 2 264.0 | 73.8 | 88.2 | 90.1 | 83.2 |
| Art and craft | 687.5 | 386.5 | 241.7 | 1 315.6 | 64.5 | 47.2 | 28.9 | 48.3 |
| Reading for pleasure | 767.3 | 635.8 | 562.7 | 1 965.8 | 72.0 | 77.6 | 67.2 | 72.2 |
| Homework or other study | 779.3 | 722.1 | 741.7 | 2 243.1 | 73.1 | 88.1 | 88.6 | 82.4 |
|
| (a) Children aged 5 to 14 years who participated in selected other activities outside of school hours during the 12 months prior to interview in April 2009. |
| (b) Any screen-based activities aside from watching TV, DVDs and videos. This may include, but is not limited to, using the computer or Internet, playing games on a games console or mobile phone, and creating music playlists or viewing photos on an MP3 player. |
| Source: Children's Participation in Cultural and Leisure Activities, Australia, April 2009 (cat. no. 4901.0). |
While participation rates were similar for boys and girls for some leisure activities (watching TV, DVDs and videos and homework or other study) they varied for others. Boys were more likely to participate in other screen-based activities (87%) compared with 80% for girls. Boys also had a higher participation rate for bike riding when compared with girls (66% and 54% respectively) as well as for skateboarding, rollerblading or riding a scooter (56% and 42% respectively). In contrast, girls were more likely to participate in reading for pleasure (80%) and art and craft activities (60%) than boys (65% and 37% respectively).
Children participating in selected other activities(a), By sex - 2009 |
|
| NUMBER ('000) | PARTICIPATION RATE (%) |
| Males | Females | Persons | Males | Females | Persons |
|
| Skateboarding, rollerblading or riding a scooter | 780.4 | 562.2 | 1 342.6 | 55.9 | 42.4 | 49.3 |
| Bike riding | 922.5 | 721.1 | 1 643.6 | 66.1 | 54.4 | 60.4 |
| Watching TV, DVDs or videos | 1 354.2 | 1 296.2 | 2 650.4 | 97.0 | 97.7 | 97.4 |
| Other screen-based activities(b) | 1 207.1 | 1 056.9 | 2 264.0 | 86.5 | 79.7 | 83.2 |
| Art and craft | 521.5 | 794.2 | 1 315.7 | 37.4 | 59.9 | 48.3 |
| Reading for pleasure | 901.9 | 1 063.9 | 1 965.8 | 64.6 | 80.2 | 72.2 |
| Homework or other study | 1 117.6 | 1 125.6 | 2 243.1 | 80.1 | 84.8 | 82.4 |
|
| (a) Children aged 5 to 14 years who participated in selected other activities outside of school hours during the 12 months prior to interview in April 2009. |
| (b) Any screen-based activities aside from watching TV, DVDs and videos. This may include, but is not limited to, using the computer or Internet, playing games on a games console or mobile phone, and creating music playlists or viewing photos on an MP3 player. |
| Source: Children's Participation in Cultural Leisure Activities, Australia, April 2009 (cat. no. 4901.0). |
 Print Page
 Print All