 MAIN FEATURES
Population change
State and territory highlights
Capital city growth
Inner-city growth
Outer suburban growth
Urban infill
Growth along the coast
Growth in inland areas
Population declines
Population change by Remoteness Areas
Population density
Centre of population
POPULATION CHANGE
Australia's estimated resident population (ERP) reached 22.33 million at 30 June 2010, increasing by 377,100 people since 30 June 2009. This represents an annual growth rate of 1.7%, the lowest since the year ended 30 June 2006. This is the first time since 2003-04 that Australia's annual growth rate has been lower than its annual average growth rate for the last five years.
All states and territories experienced population growth in 2009-10, with the largest population increases continuing to be recorded in Australia's three most populous states. New South Wales experienced the greatest growth (up by 105,400 people), followed by Victoria (99,300) and Queensland (89,100). This is only the second time in the last nine years that Queensland has not had the largest growth of all states and territories.
For the fourth consecutive year, Western Australia recorded the fastest population growth rate at 2.2% in 2009-10, ahead of Queensland (2.0%), Victoria (1.8%) and the Australian Capital Territory (1.8%). The remaining states and territories had population growth rates below the Australian average, with Tasmania experiencing the slowest growth at 0.9%.
Population growth continued to be most prominent in inner-city areas, outer suburbs, some urban infill areas and along the coast. Areas that have seen decline include inland, rural areas that have been affected by drought in the last few years or mining areas.
SLA POPULATION CHANGE, Australia
- 2009-10
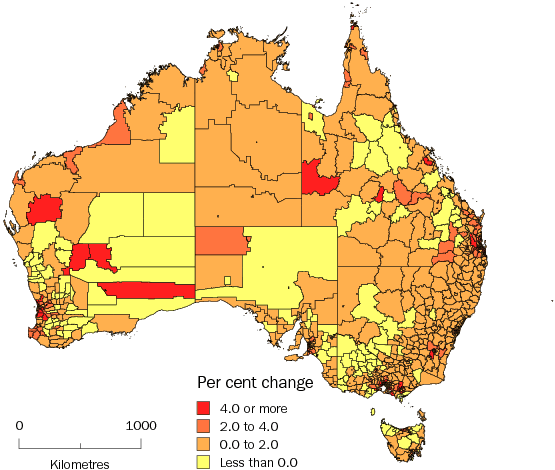
The following commentary refers mainly to population changes in Local Government Areas (LGAs). However, in some cases selected Statistical Local Areas (SLAs) are referred to, particularly where LGAs cover multiple SLAs, such as in Brisbane (C), or don't exist, such as in the Australian Capital Territory.
STATE AND TERRITORY HIGHLIGHTS
New South Wales
- Sydney SD reached 4.58 million people, an increase of 75,600 (1.7%), and continued to be the most populated capital city in Australia.
- In 2009-10, nine of the ten fastest-growing LGAs in New South Wales were within Sydney SD, including Canada Bay (A) (3.7%) in the inner west, Parramatta (C) (3.0%) in central western Sydney and Camden (A) (2.9%) in outer south-western Sydney.
Victoria
- Melbourne SD's growth of 79,000 people was the largest of all the Australian capital city SDs in 2009-10.
- The LGA of Wyndham (C), located on the western suburban fringe of Melbourne SD, experienced the largest and fastest growth (12,600 people or 8.8%) of all Victorian LGAs.
- The fastest population growth outside of the Melbourne SD occurred in the coastal LGA of Bass Coast (S) (4.6%).
Queensland
- The three most populous LGAs in Australia, Brisbane (C), Gold Coast (C) and Moreton Bay (R), recorded three of the four largest increases in population in 2009-10. Brisbane (C) increased by 14,800 people, Gold Coast (C) by 12,900, and Moreton Bay (R) by 11,100.
- Outside of south-east Queensland, the LGA of Townsville (C) reported the largest growth in the year to June 2010, with an increase of 4,000 people (2.2%).
South Australia
- Playford (C), in the northern suburbs of Adelaide SD, and Alexandrina (DC) on the Fleurieu Peninsula, were the fastest-growing LGAs in the state, both increasing by 3.0%.
- During 2009-10, the LGAs with the largest population growth in the state were Onkaparinga (C) in Adelaide's southern suburbs and Salisbury (C) in the north, which both increased by 2,400 people.
Western Australia
- Strong population growth continued in the outer suburban fringes of Perth SD.
- South West SD was the state's fastest-growing region (3.0%), followed by Pilbara SD and Perth SD (both 2.3%).
- Together, just five LGAs (Wanneroo (C), Rockingham (C), Stirling (C), Swan (C) and Armadale (C)) accounted for more than one-third of the growth across the state in the year to June 2010.
Tasmania
- Tasmania's population grew by 4,400 people in 2009-10 to 507,600. All four Tasmanian SDs experienced population growth.
- Latrobe (M) (up 4.2%) in the north and Brighton (M) (3.5%) in the south were the fastest-growing LGAs. The LGAs with the largest growth were Clarence (C) (up 800), Kingborough (M) (710) and Brighton (M) (550), all within commuting distance of Hobart.
Northern Territory
- Litchfield (M) and Palmerston (C) were the fastest-growing LGAs in the Northern Territory, increasing by 2.9% and 2.6% respectively.
- Outside of Darwin SD, the fastest-growing LGAs were Victoria-Daly (S) (2.2%), East Arnhem (S) (1.8%) and Roper Gulf (S) (1.8%).
Australian Capital Territory
- In 2009-10, population growth was largest in northern suburban Canberra, especially in the SLAs of Franklin (870 people), Macgregor (800), Forde (380) and Harrison (380).
- For the third year in a row, the combined population of the northern SSDs (185,000 people) was greater than that of the combined southern SSDs (173,500).
CAPITAL CITY GROWTH
At 30 June 2010, more than 14.30 million people, close to two-thirds of Australia's population, resided in a capital city Statistical Division (SD). The combined population of capital city SDs increased by 257,800 in the 12 months to June 2010.
In 2009-10, Melbourne recorded the largest growth of all capital city SDs, increasing by 79,000 people, followed by Sydney (75,600), Brisbane (39,000) and Perth (37,500). Population growth in Melbourne SD equated to an average increase of over 1,500 people per week, while the population of Sydney SD increased by over 1,400 people per week.
Population growth in Australia's capital city SDs occurred at a rate of 1.8% in 2009-10, faster than that in the remainder of Australia (1.5%). Adelaide SD and Greater Hobart SD had the lowest growth rates at 1.3%.
INNER-CITY GROWTH
In 2009-10, the inner-city LGAs of Sydney (C) and Melbourne (C) had population increases among the largest in Australia, increasing by 4,500 and 3,400 people respectively. Perth (C) was the fastest-growing of all the inner capital city LGAs, increasing in population from 17,100 to 18,000 people or 5.1%.
The 2009-10 growth rates in the inner capital city LGAs of Perth (C) (5.1%), Melbourne (C) (3.6%), Sydney (C) (2.5%) and Adelaide (C) (2.2%) were lower than their average annual growth rates over the five years to June 2010. Previous construction of multistorey apartment buildings in these capital city LGAs had led to higher rates of population growth in earlier years.
OUTER SUBURBAN GROWTH
In the 12 months to June 2010, many LGAs which experienced large and/or rapid growth were located on or near the boundaries of capital city SDs, where more land tends to be available for subdivision and housing development. In Melbourne SD, the population in outer suburban Wyndham (C) increased by 12,600 (8.8%), which was both the largest and fastest increase of all Victorian LGAs. Strong growth was also experienced in Whittlesea (C) (up 8,900 people or 6.1%) and Casey (C) (8,100 people or 3.3%).
Among the LGAs with the largest population increases in New South Wales in 2009-10 were outer suburban Blacktown (C) (up 8,300 people), The Hills Shire (A) and Liverpool (C) (both 3,400).
The LGAs of Wanneroo (C) and Rockingham (C), on the northern and south-western outskirts of the Perth SD recorded strong growth in 2009-10, increasing by 6,000 and 3,900 people respectively.
In the Brisbane SD, the largest growth occurred in the outer suburban SLAs of Ipswich (C) - East (3,200 people), Griffin-Mango Hill (2,100) and Ipswich (C) - Central (2,000) for the 12 months to June 2010.
Outer suburban areas in the smaller capital city SDs also experienced some of the strongest growth in their states or territories. In 2009-10, the largest population increases of all LGAs in South Australia were in the outer Adelaide LGAs of Onkaparinga (C) (up 2,400 people), Salisbury (C) (2,400) and Playford (C) (2,300). On the outskirts of Darwin, the population in the SLAs of Lee Point-Leanyer Swamp increased by 730 and in Palmerston (C) Bal by 580. In Greater Hobart, the outer LGA of Clarence (C) increased by 800 people, the largest increase in Tasmania; and in Canberra, the SLAs of Franklin and Macgregor had the largest growth, increasing by 870 and 800 people respectively. The SLAs of Forde and Harrison also had large growth increasing by 380 people each.
URBAN INFILL
Urban infill is the development of a site within an already-developed area, either by building housing on land that was previously vacant or used for non-residential purposes, or by replacing low-density housing with higher-density dwellings. Infill development is becoming more common on transport corridors, near commercial hubs and in suburbs where there are older houses on large blocks of land.
In 2009-10, urban infill contributed to a large population increase in Parramatta (C), Canada Bay (A) and Auburn (C), all located along the Parramatta River in western Sydney, where the population increased by 5,100, 2,800 and 2,200 respectively.
GROWTH ALONG THE COAST
Outside of capital city SDs, the largest population growth generally occurred along the Australian coast in 2009-10. Several LGAs on Queensland's seaboard had large population increases including the Gold Coast (C) (up 12,900 people) and Sunshine Coast (R) (7,500) in south-east Queensland, and Townsville (C) (4,000) and Cairns (R) (3,900) in the north.
In 2009-10, the seaside LGA of Wollongong (C) in NSW experienced the largest growth outside of Sydney SD (up 2,300 people), followed by Lake Macquarie (C) (1,800) and Newcastle (C) (1,500), both on the coast to the north of Sydney.
Many coastal LGAs in Western Australia were also among the fastest-growing in Australia. Rapid population growth occurred in 2009-10 in Capel (S) (5.4%) and Busselton (S) (4.1%).
GROWTH IN INLAND AREAS
Some LGAs in inland areas outside of capital city SDs also experienced rapid growth in the 12 months to June 2010. Chittering (S), which is north of Perth SD experienced the fastest increase of all inland LGAs (up 4.9%).
Other fast growing inland LGAs in 2009-10 include Somerset (R) (4.2%) to the north-west of Brisbane, and Yass Valley (A) (2.8%) and Palerang (A) (2.2%) in New South Wales near the Australian Capital Territory border.
POPULATION DECLINES
Population losses in 2009-10 mainly occurred in inland rural Australia, particularly in north-eastern and south-eastern parts of Australia and in rural Western Australia. These are areas that may have been affected by drought in the last few years or mining areas.
Broken Hill (C) in New South Wales experienced the largest population decline in the year to June 2010 (120 people). Other LGAs with population declines were Yarriambiack (S) (down 70 people), Hindmarsh (S) (60) and Gannawarra (S) (60), all in Victoria.
The fastest declines in population in 2009-10 occurred in Ravensthorpe (S) and Moora (S) in Western Australia, down 2.2% and 1.2% respectively. These were followed by the LGAs of Yarriambiack (S) (0.9%) and Hindmarsh (S) (0.9%) in Victoria.
POPULATION CHANGE BY REMOTENESS AREAS
As at June 2010, 68.7% of the population resided in Australia's major cities, as defined in the Remoteness Structure of the
Australian Standard Geographical Classification (cat. no. 1216.0). In comparison, just 2.3% lived in remote or very remote Australia. Major cities and inner regional areas were the fastest-growing remoteness areas (RAs) in Australia (both 1.8%) in the 12 months to June 2010. The remaining RAs grew slower than Australia as a whole (1.7%), with remote areas growing at the slowest rate (0.8%).
The Australian Capital Territory had the greatest proportion of its population living in the major cities RA (99.8%) at June 2010, while Tasmania had the highest percentage (64.8%) living in inner regional Australia, which includes Hobart. The Northern Territory had the highest proportion of its population living in outer regional Australia (56.0%), which includes Darwin, as well as remote (21.2%) and very remote (22.8%) Australia.
In 2009-10, major cities were the fastest-growing RAs in Victoria (1.9%) and New South Wales (1.6%), while inner regional areas were the fastest-growing in Western Australia (3.7%), South Australia (1.8%) and Tasmania (1.0%). In Queensland, major cities and inner regional areas experienced the equal fastest growth (both 2.1%). Outer regional RAs experienced the fastest growth in the Northern Territory (2.1%).
ESTIMATED RESIDENT POPULATION BY REMOTENESS STRUCTURE(a) |
|
 | | ERP at 30 June | Change |
| | 2009r | 2010p | 2009r-10p |
| | no. | no. | no. | % |
|
| NSW | | | | |
| Major Cities | 5 195 849 | 5 279 542 | 83 693 | 1.6 |
| Inner Regional | 1 442 816 | 1 461 618 | 18 802 | 1.3 |
| Outer Regional | 451 094 | 453 948 | 2 854 | 0.6 |
| Remote | 32 922 | 32 991 | 69 | 0.2 |
| Very Remote | 4 487 | 4 490 | 3 | 0.1 |
| Total | 7 127 168 | 7 232 589 | 105 421 | 1.5 |
| Vic. | | | | |
| Major Cities | 4 093 699 | 4 171 765 | 78 066 | 1.9 |
| Inner Regional | 1 089 727 | 1 109 580 | 19 853 | 1.8 |
| Outer Regional | 258 452 | 259 869 | 1 417 | 0.5 |
| Remote | 4 734 | 4 718 | -16 | -0.3 |
| Total | 5 446 612 | 5 545 932 | 99 320 | 1.8 |
| Qld | | | | |
| Major Cities | 2 644 191 | 2 699 182 | 54 991 | 2.1 |
| Inner Regional | 970 977 | 991 310 | 20 333 | 2.1 |
| Outer Regional | 672 876 | 685 272 | 12 396 | 1.8 |
| Remote | 86 522 | 87 221 | 699 | 0.8 |
| Very Remote | 50 201 | 50 865 | 664 | 1.3 |
| Total | 4 424 767 | 4 513 850 | 89 083 | 2.0 |
| SA | | | | |
| Major Cities | 1 181 789 | 1 196 731 | 14 942 | 1.3 |
| Inner Regional | 198 620 | 202 195 | 3 575 | 1.8 |
| Outer Regional | 183 920 | 185 061 | 1 141 | 0.6 |
| Remote | 46 200 | 46 494 | 294 | 0.6 |
| Very Remote | 13 983 | 14 101 | 118 | 0.8 |
| Total | 1 624 512 | 1 644 582 | 20 070 | 1.2 |
| WA | | | | |
| Major Cities | 1 598 608 | 1 632 570 | 33 962 | 2.1 |
| Inner Regional | 296 159 | 307 122 | 10 963 | 3.7 |
| Outer Regional | 203 175 | 205 472 | 2 297 | 1.1 |
| Remote | 97 388 | 98 686 | 1 298 | 1.3 |
| Very Remote | 49 106 | 49 660 | 554 | 1.1 |
| Total | 2 244 436 | 2 293 510 | 49 074 | 2.2 |
| Tas. | | | | |
| Inner Regional | 325 487 | 328 815 | 3 328 | 1.0 |
| Outer Regional | 167 378 | 168 380 | 1 002 | 0.6 |
| Remote | 7 830 | 7 865 | 35 | 0.4 |
| Very Remote | 2 597 | 2 583 | -14 | -0.5 |
| Total | 503 292 | 507 643 | 4 351 | 0.9 |
| NT | | | | |
| Outer Regional | 125 967 | 128 607 | 2 640 | 2.1 |
| Remote | 48 464 | 48 668 | 204 | 0.4 |
| Very Remote | 51 776 | 52 436 | 660 | 1.3 |
| Total | 226 207 | 229 711 | 3 504 | 1.5 |
| ACT | | | | |
| Major Cities | 351 766 | 357 931 | 6 165 | 1.8 |
| Inner Regional | 519 | 640 | 121 | 23.3 |
| Total | 352 285 | 358 571 | 6 286 | 1.8 |
| Australia (b) | | | | |
| Major Cities | 15 065 902 | 15 337 721 | 271 819 | 1.8 |
| Inner Regional | 4 324 696 | 4 401 672 | 76 976 | 1.8 |
| Outer Regional | 2 062 862 | 2 086 609 | 23 747 | 1.2 |
| Remote | 324 060 | 326 643 | 2 583 | 0.8 |
| Very Remote | 174 216 | 176 202 | 1 986 | 1.1 |
| Total | 21 951 736 | 22 328 847 | 377 111 | 1.7 |
|
| (a) See paragraphs 21 to 23 and paragraph 30 of the Explanatory Notes. |
| (b) Includes Other Territories. |
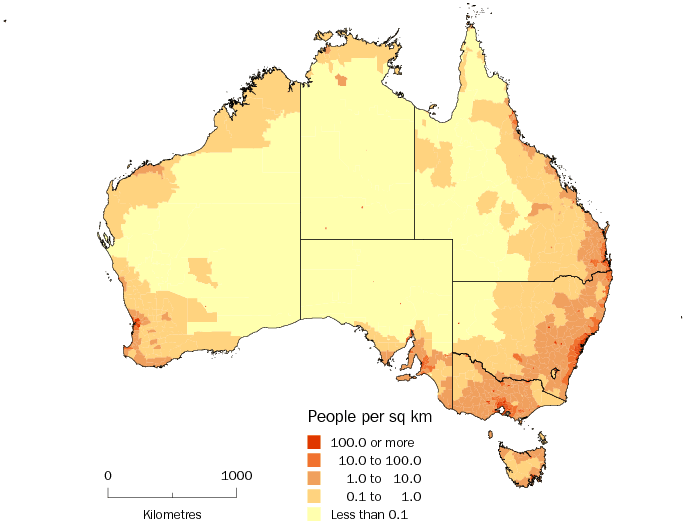
POPULATION DENSITY
Population density varies greatly across Australia, ranging from very low in remote areas to very high in inner-city areas. Australia's population density at June 2010 was 2.9 people per square kilometre (sq km). Among the states and territories, the Australian Capital Territory had the highest population density at 152.5 people per sq km, followed by Victoria with 24.4, New South Wales with 9.0 and Tasmania with 7.5. The remaining states and territories all had population densities below the Australian figure, with the Northern Territory having the lowest at just 0.2 people per sq km.
Population density at June 2010 was highest in capital city SDs, particularly in Sydney SD. Six of the top ten most densely-populated SLAs were in Sydney SD, including Sydney (C) - East, which had the highest population density in Australia (8,800 people per sq km), the neighbouring Sydney (C) - West (7,900) and Waverley (A) (7,500), which contains the eastern beach-side suburbs of Bondi and Bronte. Within Melbourne SD, the SLAs with the greatest population densities were Melbourne (C) - Inner (8,000 people per sq km) and nearby Port Phillip (C) - St Kilda (6,400). In Brisbane SD, New Farm (5,900) and Kangaroo Point (5,600) had the highest population densities.
At the other end of the scale, there were over 240 SLAs in Australia which had population densities of less than one person per sq km at June 2010, almost one-third of which were located in Western Australia.
Between June 2009 and June 2010, the SLA which recorded the largest increase in population density was Franklin in the Australian Capital Territory (an extra 380 people per sq km), a relatively newly developed area. This was followed by Melbourne (C) - Inner (an extra 270 people per sq km) and Melbourne (C) - Southbank - Docklands (up 220 people per sq km), both inner-city areas.
POPULATION DENSITY BY SLA, Australia
- June 2010
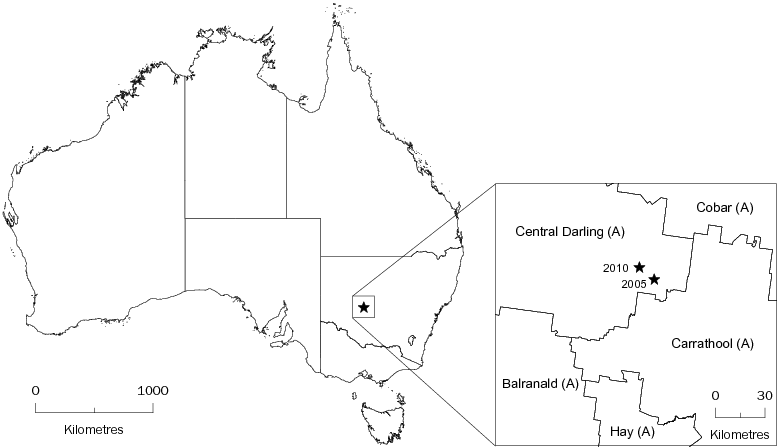
CENTRE OF POPULATION
The centre of population is one way in which the spatial distribution of Australia's population can be described. This point marks the average latitude and longitude around which the population is distributed.
Australia's centre of population at June 2010 was approximately 47 kilometres east of the small service town of Ivanhoe, in the western New South Wales LGA of Central Darling (A). The centre of population moved approximately 11.5 kilometres north-west in the five years from June 2005 to June 2010. This shift reflects strong population growth in northern New South Wales, Queensland and Western Australia.
CENTRE OF POPULATION, Australia
- June 2005 and June 2010
ESTIMATED RESIDENT POPULATION, States and Territories - Capital City and Balance of State/Territory |
|
| | ERP at 30 June | Change |
| | 2009r | 2010p | 2009r-10p |
| Part of S/T | no. | no. | no. | % |
|
| NSW | | | | |
| Sydney SD | 4 499 888 | 4 575 532 | 75 644 | 1.7 |
| Balance of state | 2 627 280 | 2 657 057 | 29 777 | 1.1 |
| Total | 7 127 168 | 7 232 589 | 105 421 | 1.5 |
| Vic. | | | | |
| Melbourne SD | 3 998 022 | 4 077 036 | 79 014 | 2.0 |
| Balance of state | 1 448 590 | 1 468 896 | 20 306 | 1.4 |
| Total | 5 446 612 | 5 545 932 | 99 320 | 1.8 |
| Qld | | | | |
| Brisbane SD | 2 004 225 | 2 043 185 | 38 960 | 1.9 |
| Balance of state | 2 420 542 | 2 470 665 | 50 123 | 2.1 |
| Total | 4 424 767 | 4 513 850 | 89 083 | 2.0 |
| SA | | | | |
| Adelaide SD | 1 188 139 | 1 203 186 | 15 047 | 1.3 |
| Balance of state | 436 373 | 441 396 | 5 023 | 1.2 |
| Total | 1 624 512 | 1 644 582 | 20 070 | 1.2 |
| WA | | | | |
| Perth SD | 1 658 520 | 1 696 065 | 37 545 | 2.3 |
| Balance of state | 585 916 | 597 445 | 11 529 | 2.0 |
| Total | 2 244 436 | 2 293 510 | 49 074 | 2.2 |
| Tas. | | | | |
| Hobart SD | 212 019 | 214 705 | 2 686 | 1.3 |
| Balance of state | 291 273 | 292 938 | 1 665 | 0.6 |
| Total | 503 292 | 507 643 | 4 351 | 0.9 |
| NT | | | | |
| Darwin SD | 124 909 | 127 532 | 2 623 | 2.1 |
| Balance of territory | 101 298 | 102 179 | 881 | 0.9 |
| Total | 226 207 | 229 711 | 3 504 | 1.5 |
| ACT | | | | |
| Canberra SD | 351 964 | 358 222 | 6 258 | 1.8 |
| Balance of territory | 321 | 349 | 28 | 8.7 |
| Total | 352 285 | 358 571 | 6 286 | 1.8 |
| Other Territories | 2 457 | 2 459 | 2 | 0.1 |
| Australia | | | | |
| Capital City | 14 037 686 | 14 295 463 | 257 777 | 1.8 |
| Balance of Australia(a) | 7 914 050 | 8 033 384 | 119 334 | 1.5 |
| Total | 21 951 736 | 22 328 847 | 377 111 | 1.7 |
|
| (a) Includes Other Territories. |
LGAs WITH LARGEST POPULATION CHANGES IN 2009-10 |
|
| | ERP at 30 June | Change |
| | 2009r | 2010p | 2009r-10p |
| National rank & LGA(a) | Part of S/T | no. | no. | no. | % |
LARGEST INCREASES |
|
| 1 Brisbane (C) | Brisbane | 1 052 438 | 1 067 279 | 14 841 | 1.4 |
| 2 Gold Coast (C) | Qld Bal | 514 885 | 527 828 | 12 943 | 2.5 |
| 3 Wyndham (C) | Melbourne | 143 969 | 156 573 | 12 604 | 8.8 |
| 4 Moreton Bay (R) | Brisbane | 371 155 | 382 280 | 11 125 | 3.0 |
| 5 Whittlesea (C) | Melbourne | 146 223 | 155 113 | 8 890 | 6.1 |
| 6 Blacktown (C) | Sydney | 299 492 | 307 816 | 8 324 | 2.8 |
| 7 Casey (C) | Melbourne | 247 511 | 255 659 | 8 148 | 3.3 |
| 8 Sunshine Coast (R) | Qld Bal | 323 419 | 330 934 | 7 515 | 2.3 |
| 9 Melton (S) | Melbourne | 100 062 | 107 150 | 7 088 | 7.1 |
| 10 Wanneroo (C) | Perth | 144 107 | 150 106 | 5 999 | 4.2 |
| 11 Ipswich (C) | Brisbane | 162 381 | 168 131 | 5 750 | 3.5 |
| 12 Logan (C) | Brisbane | 277 560 | 282 673 | 5 113 | 1.8 |
| 13 Parramatta (C) | Sydney | 167 261 | 172 333 | 5 072 | 3.0 |
| 14 Cardinia (S) | Melbourne | 68 684 | 73 318 | 4 634 | 6.7 |
| 15 Sydney (C) | Sydney | 177 738 | 182 226 | 4 488 | 2.5 |
| 16 Hume (C) | Melbourne | 167 644 | 171 996 | 4 352 | 2.6 |
| 17 Townsville (C) | Qld Bal | 181 740 | 185 768 | 4 028 | 2.2 |
| 18 Rockingham (C) | Perth | 100 203 | 104 130 | 3 927 | 3.9 |
| 19 Cairns (R) | Qld Bal | 164 354 | 168 251 | 3 897 | 2.4 |
| 20 Greater Geelong (C) | Vic. Bal | 216 465 | 220 068 | 3 603 | 1.7 |
| 21 The Hills Shire (A) | Sydney | 176 308 | 179 716 | 3 408 | 1.9 |
| 22 Liverpool (C) | Sydney | 182 076 | 185 481 | 3 405 | 1.9 |
| 23 Melbourne (C) | Melbourne | 93 163 | 96 552 | 3 389 | 3.6 |
| 24 Brimbank (C) | Melbourne | 186 006 | 189 386 | 3 380 | 1.8 |
| 25 Stirling (C) | Perth | 198 746 | 202 014 | 3 268 | 1.6 |
LARGEST DECLINES |
|
| 1 Broken Hill (C) | NSW Bal | 19 940 | 19 818 | -122 | -0.6 |
| 2 Yarriambiack (S) | Vic. Bal | 7 686 | 7 614 | -72 | -0.9 |
| 3 Hindmarsh (S) | Vic. Bal | 6 206 | 6 150 | -56 | -0.9 |
| 4 Gannawarra (S) | Vic. Bal | 11 672 | 11 617 | -55 | -0.5 |
| 5 Buloke (S) | Vic. Bal | 7 082 | 7 028 | -54 | -0.8 |
| 6 Deniliquin (A) | NSW Bal | 7 685 | 7 633 | -52 | -0.7 |
| 7 Ravensthorpe (S) | WA Bal | 2 401 | 2 349 | -52 | -2.2 |
| 8 Dundas (S) | WA Bal | 1 204 | 1 159 | -45 | -3.7 |
| 9 Narrogin (S) | WA Bal | 909 | 865 | -44 | -4.8 |
| 10 Southern Grampians (S) | Vic. Bal | 17 574 | 17 531 | -43 | -0.2 |
| 11 Loddon (S) | Vic. Bal | 8 084 | 8 047 | -37 | -0.5 |
| 12 Circular Head (M) | Tas. Bal | 8 300 | 8 263 | -37 | -0.4 |
| 13 Wakool (A) | NSW Bal | 4 422 | 4 389 | -33 | -0.7 |
| 14 Mount Marshall (S) | WA Bal | 686 | 653 | -33 | -4.8 |
| 15 Lake Grace (S) | WA Bal | 1 482 | 1 450 | -32 | -2.2 |
| 16 Northern Grampians (S) | Vic. Bal | 12 347 | 12 316 | -31 | -0.3 |
| 17 Moora (S) | WA Bal | 2 574 | 2 543 | -31 | -1.2 |
| 18 Three Springs (S) | WA Bal | 732 | 704 | -28 | -3.8 |
| 19 Northern Areas (DC) | SA Bal | 4 869 | 4 843 | -26 | -0.5 |
| 20 Broomehill-Tambellup (S) | WA Bal | 1 282 | 1 256 | -26 | -2.0 |
| 21 West Wimmera (S) | Vic. Bal | 4 616 | 4 591 | -25 | -0.5 |
| 22 Brookton (S) | WA Bal | 1 031 | 1 006 | -25 | -2.4 |
| 23 Mount Magnet (S) | WA Bal | 664 | 639 | -25 | -3.8 |
| 24 Cue (S) | WA Bal | 302 | 278 | -24 | -7.9 |
| 25 The Coorong (DC) | SA Bal | 5 828 | 5 805 | -23 | -0.4 |
|
| (a) National rank based on numerical change in population between June 2009 and June 2010. See paragraphs 18 and 19 of the Explanatory Notes. |
LGAs WITH FASTEST POPULATION CHANGES IN 2009-10 |
|
| | ERP at 30 June | Change |
| | 2009r | 2010p | 2009r-10p |
| National rank & LGA(a) | Part of S/T | no. | no. | no. | % |
FASTEST INCREASES |
|
| 1 Wyndham (C) | Melbourne | 143 969 | 156 573 | 12 604 | 8.8 |
| 2 Melton (S) | Melbourne | 100 062 | 107 150 | 7 088 | 7.1 |
| 3 Cardinia (S) | Melbourne | 68 684 | 73 318 | 4 634 | 6.7 |
| 4 Whittlesea (C) | Melbourne | 146 223 | 155 113 | 8 890 | 6.1 |
| 5 Capel (S) | WA Bal | 12 684 | 13 370 | 686 | 5.4 |
| 6 Perth (C) | Perth | 17 089 | 17 955 | 866 | 5.1 |
| 7 Armadale (C) | Perth | 58 136 | 60 983 | 2 847 | 4.9 |
| 8 Chittering (S) | WA Bal | 4 309 | 4 519 | 210 | 4.9 |
| 9 Northern Peninsula Area (R) | Qld Bal | 2 282 | 2 389 | 107 | 4.7 |
| 10 Bass Coast (S) | Vic. Bal | 29 603 | 30 974 | 1 371 | 4.6 |
| 11 Serpentine-Jarrahdale (S) | Perth | 16 487 | 17 212 | 725 | 4.4 |
| 12 Murray (S) | WA Bal | 14 759 | 15 401 | 642 | 4.3 |
| 13 Somerset (R) | Qld Bal | 21 608 | 22 519 | 911 | 4.2 |
| 15 Latrobe (M) | Tas. Bal | 9 616 | 10 020 | 404 | 4.2 |
| 14 Wanneroo (C) | Perth | 144 107 | 150 106 | 5 999 | 4.2 |
| 16 Busselton (S) | WA Bal | 30 505 | 31 767 | 1 262 | 4.1 |
| 17 Port Hedland (T) | WA Bal | 14 068 | 14 624 | 556 | 4.0 |
| 18 Rockingham (C) | Perth | 100 203 | 104 130 | 3 927 | 3.9 |
| 19 Baw Baw (S) | Vic. Bal | 41 351 | 42 921 | 1 570 | 3.8 |
| 20 Canada Bay (A) | Sydney | 75 922 | 78 735 | 2 813 | 3.7 |
| 21 Melbourne (C) | Melbourne | 93 163 | 96 552 | 3 389 | 3.6 |
| 22 Yarrabah (S) | Qld Bal | 2 628 | 2 722 | 94 | 3.6 |
| 23 Kwinana (T) | Perth | 28 036 | 29 029 | 993 | 3.5 |
| 24 Ipswich (C) | Brisbane | 162 381 | 168 131 | 5 750 | 3.5 |
| 25 Brighton (M) | Greater Hobart | 15 807 | 16 358 | 551 | 3.5 |
FASTEST DECLINES |
|
| 1 Ravensthorpe (S) | WA Bal | 2 401 | 2 349 | -52 | -2.2 |
| 2 Moora (S) | WA Bal | 2 574 | 2 543 | -31 | -1.2 |
| 3 Yarriambiack (S) | Vic. Bal | 7 686 | 7 614 | -72 | -0.9 |
| 4 Hindmarsh (S) | Vic. Bal | 6 206 | 6 150 | -56 | -0.9 |
| 5 Southern Mallee (DC) | SA Bal | 2 190 | 2 172 | -18 | -0.8 |
| 6 Buloke (S) | Vic. Bal | 7 082 | 7 028 | -54 | -0.8 |
| 7 Wakool (A) | NSW Bal | 4 422 | 4 389 | -33 | -0.7 |
| 8 Deniliquin (A) | NSW Bal | 7 685 | 7 633 | -52 | -0.7 |
| 9 Broken Hill (C) | NSW Bal | 19 940 | 19 818 | -122 | -0.6 |
| 10 West Wimmera (S) | Vic. Bal | 4 616 | 4 591 | -25 | -0.5 |
| 11 Hay (A) | NSW Bal | 3 367 | 3 349 | -18 | -0.5 |
| 12 Northern Areas (DC) | SA Bal | 4 869 | 4 843 | -26 | -0.5 |
| 13 Gannawarra (S) | Vic. Bal | 11 672 | 11 617 | -55 | -0.5 |
| 14 Loddon (S) | Vic. Bal | 8 084 | 8 047 | -37 | -0.5 |
| 15 Circular Head (M) | Tas. Bal | 8 300 | 8 263 | -37 | -0.4 |
| 16 The Coorong (DC) | SA Bal | 5 828 | 5 805 | -23 | -0.4 |
| 17 Lachlan (A) | NSW Bal | 6 865 | 6 844 | -21 | -0.3 |
| 18 Dorset (M) | Tas. Bal | 7 377 | 7 355 | -22 | -0.3 |
| 19 Northern Grampians (S) | Vic. Bal | 12 347 | 12 316 | -31 | -0.3 |
| 20 Southern Grampians (S) | Vic. Bal | 17 574 | 17 531 | -43 | -0.2 |
| 21 Carrathool (A) | NSW Bal | 2 961 | 2 954 | -7 | -0.2 |
| 22 Wellington (A) | NSW Bal | 8 895 | 8 875 | -20 | -0.2 |
| 23 Roxby Downs (M) | SA Bal | 4 487 | 4 478 | -9 | -0.2 |
| 24 Queenscliffe (B) | Vic. Bal | 3 320 | 3 314 | -6 | -0.2 |
| 25 Waratah/Wynyard (M) | Tas. Bal | 14 117 | 14 096 | -21 | -0.1 |
|
| (a) National rank based on percentage change in population between June 2009 and June 2010, excluding LGAs with a population of less than 2,000 at June 2009. See paragraphs 18 and 19 of the Explanatory Notes. |
 Quality Declaration
  Print Page
 Print All