 STATISTICAL LOCAL AREAS IN AUSTRALIA
HIGH AND LOW TURNOVER STATISTICAL LOCAL AREAS
On this page:
Introduction
Characteristics of Statistical Local Areas with high population turnover
Characteristics of Statistical Local Areas with low population turnover
Introduction
The population turnover for Statistical Local Areas (SLAs) across Australia varied from 174.1% for City - Remainder (in Darwin, the capital city of the Northern Territory) to 7.5% in Angurugu (CGC), (on Groote Eylandt island off the coast of the Northern Territory, in the Gulf of Carpentaria). This chapter looks at the top twenty (referred to as high turnover) and bottom twenty (referred to as low turnover) SLAs in this range and uses data from the 2006 Census of Population and Housing to determine any similarities and/or differences in their characteristics. Most high turnover SLAs were either in the Northern Territory or the Australian Capital Territory (refer Table 1.1) and all low turnover SLAs were either in the Northern Territory or Queensland (refer Table 1.2).
To view images of the high turnover SLAs via Google Maps Australia please click on the following links:
TABLE 1.1. HIGH POPULATION TURNOVER , By SLA - Australia |
|  |
| | 2001 Census count(a) | 2006 Census count | Census count change | Arrivals(b) | Departures(c) | Net migration(c) | Population flow(c) | Population turnover(c) | |
| State | SLA(d) | psns | psns | psns | psns | psns | psns | psns | % | |
| |
| NT | City - Remainder | 2 791 | 2 301 | -490 | 1 440 | 1 532 | -92 | 2 972 | 174.1 | |
| ACT | Duntroon | 1 258 | 1 683 | 425 | 1 518 | 769 | 749 | 2 287 | 147.8 | |
| NT | Jabiru (T) | 1 108 | 1 139 | 31 | 447 | 596 | -149 | 1 043 | 146.9 | |
| NT | Durack | 2 393 | 2 687 | 294 | 1 595 | 1 579 | 16 | 3 174 | 145.5 | |
| NT | City - Inner | 2 196 | 2 482 | 286 | 1 317 | 1 269 | 48 | 2 586 | 143.4 | |
| ACT | Acton | 1 441 | 1 805 | 364 | 1 660 | 683 | 977 | 2 343 | 137.9 | |
| NT | Gunn-Palmerston City | 1 195 | 2 379 | 1 184 | 1 409 | 1 061 | 348 | 2 470 | 134.2 | |
| NT | Litchfield (S) - Pt A | 1 452 | 1 233 | -219 | 769 | 696 | 73 | 1 465 | 129.3 | |
| ACT | City | 596 | 719 | 123 | 429 | 216 | 213 | 645 | 127.7 | |
| NT | Larrakeyah | 3 047 | 3 037 | -10 | 1 723 | 1 422 | 301 | 3 145 | 126.3 | |
| ACT | Kingston | 1 839 | 2 454 | 615 | 1 666 | 1 000 | 666 | 2 666 | 123.9 | |
| WA | Leonora (S) | 1 929 | 1 409 | -520 | 676 | 743 | -67 | 1 419 | 122.6 | |
| NT | Alice Springs (T) - Stuart | 2 103 | 1 920 | -183 | 903 | 827 | 76 | 1 730 | 122.1 | |
| ACT | Phillip | 1 654 | 1 912 | 258 | 1 146 | 857 | 289 | 2 003 | 121.5 | |
| ACT | Belconnen Town Centre | 2 738 | 3 055 | 317 | 1 803 | 1 250 | 553 | 3 053 | 121.2 | |
| NT | The Gardens | 698 | 567 | -131 | 349 | 236 | 113 | 585 | 120.9 | |
| NT | Driver | 2 810 | 2 717 | -93 | 1 279 | 1 341 | -62 | 2 620 | 120.7 | |
| Qld | Rosslea | 1 582 | 1 447 | -135 | 786 | 690 | 96 | 1 476 | 118.9 | |
| WA | Meekatharra (S) | 1 356 | 1 134 | -222 | 319 | 566 | -247 | 885 | 118.8 | |
| NT | Nightcliff | 3 257 | 3 357 | 100 | 1 453 | 1 715 | -262 | 3 168 | 118.0 | |
| |
| (a) Based on 2006 Census boundaries |
| (b) Excludes people aged 0-4 years and those who did not state where they lived 5 years ago |
| (c) Excludes people aged 0-4 years, those who did not state where they lived 5 years ago, and overseas departures, meaning these data are estimated on a different basis than the 2006 Census count (for further information about how Population turnover is calculated, refer to Explanatory Note 14) |
| (d) Excludes unincorporated areas and SLAs with a population of less than 500 people |
| Source: Census of Population and Housing, 2006 and Census of Population and Housing, 2001 |
| Note: This table is based on place of usual residence. Cells in this table have been randomly adjusted to avoid the release of confidential data. |
TABLE 1.2. LOW POPULATION TURNOVER, By SLA - Australia |
| |
| | 2001 Census count(a) | 2006 Census count | Census count change | Arrivals(b) | Departures(c) | Net migration(c) | Population flow(c) | Population turnover(c) | |
| State | SLA(d) | psns | psns | psns | psns | psns | psns | psns | % | |
| |
| NT | Angurugu (CGC) | 800 | 816 | 16 | 32 | 21 | 11 | 53 | 7.5 | |
| NT | East Arnhem - Bal | 5 802 | 6 522 | 720 | 394 | 386 | 8 | 780 | 14.1 | |
| NT | West Arnhem | 3 066 | 3 337 | 271 | 243 | 190 | 53 | 433 | 15.3 | |
| Qld | Yarrabah (S) | 2 143 | 2 375 | 232 | 155 | 168 | -13 | 323 | 16.2 | |
| NT | Thamarrurr (CGC) | 1 513 | 1 930 | 417 | 133 | 124 | 9 | 257 | 16.9 | |
| NT | Yugul Mangi (CGC) | 1 907 | 1 641 | -266 | 123 | 109 | 14 | 232 | 17.2 | |
| Qld | Aurukun (S) | 1 033 | 1 046 | 13 | 73 | 91 | -18 | 164 | 18.3 | |
| NT | Numbulwar Numburindi (CGC) | 721 | 684 | -37 | 56 | 54 | 2 | 110 | 18.8 | |
| Qld | Kowanyama (S) | 974 | 1 023 | 49 | 71 | 105 | -34 | 176 | 19.3 | |
| NT | Kunbarllanjnja (CGC) | 852 | 882 | 30 | 77 | 83 | -6 | 160 | 20.6 | |
| Qld | Palm Island (S) | 2 133 | 1 981 | -152 | 123 | 246 | -123 | 369 | 22.4 | |
| NT | Tiwi Islands (CGC) | 2 228 | 2 129 | -99 | 192 | 232 | -40 | 424 | 22.7 | |
| Qld | Mornington (S) | 944 | 1 032 | 88 | 86 | 110 | -24 | 196 | 22.9 | |
| Qld | Napranum (S) | 720 | 838 | 118 | 91 | 77 | 14 | 168 | 23.4 | |
| Qld | Cherbourg (S) | 1 133 | 1 131 | -2 | 100 | 143 | -43 | 243 | 25.7 | |
| Qld | Pormpuraaw (S) | 582 | 597 | 15 | 81 | 54 | 27 | 135 | 26.0 | |
| Qld | Doomadgee (S) | 1 133 | 1 084 | -49 | 81 | 113 | -32 | 194 | 26.5 | |
| NT | Ltyentye Purte (CGC) | 538 | 542 | 4 | 50 | 78 | -28 | 128 | 27.4 | |
| NT | Tanami | 2 971 | 2 439 | -532 | 337 | 257 | 80 | 594 | 28.5 | |
| NT | Nyirranggulung Mardrulk Ngadberre (CGC) | 1 105 | 938 | -167 | 104 | 125 | -21 | 229 | 28.5 | |
| |
| (a) Based on 2006 Census boundaries |
| (b) Excludes people aged 0-4 years and those who did not state where they lived 5 years ago |
| (c) Excludes people aged 0-4 years, those who did not state where they lived 5 years ago, and overseas departures, meaning these data are estimated on a different basis than the 2006 Census count (for further information about how Population turnover is calculated, refer to Explanatory Note 14) |
| (d) Excludes unincorporated areas and SLAs with a population of less than 500 people |
| Source: Census of Population and Housing, 2006 and Census of Population and Housing, 2001 |
| Note: This table is based on place of usual residence. Cells in this table have been randomly adjusted to avoid the release of confidential data. |
Characteristics of Statistical Local Areas with high population turnover
High turnover SLAs were generally in urban areas of Australia and most were in either the Northern Territory (11 out of the 20) or the ACT (6). Almost three quarters of them recorded positive net migration (where arrivals outnumbered departures), with Acton, City and Duntroon (all in the ACT) recording the highest ratio of arrivals to departures in this group (2.43; 1.98; and 1.97 respectively).
Employment
Almost all high turnover SLAs had a high labour force participation rate. With the exception of Acton (with a labour force participation rate of 47.4%) high turnover SLAs had more than 70% of usual residents aged 15 years and over in the labour force, compared with 64.6% in Australia. Along with relatively high participation rates, most high turnover SLAs also had more than 70% of their labour force working full-time, compared to the average for Australia of 60.7%. The exceptions were:
- Nightcliff (69.0%)
- Meekatharra (S) (68.4%)
- Rosslea (68.0%)
- Belconnen Town Centre (60.7%)
- Acton (6.1%).
The very low rate noted above for Acton, which contains the Australian National University, may be related to its very high proportion of residents attending University or other tertiary institutions (96.8%).
The industry division (using the
Australian and New Zealand Standard Industrial Classification (ANZSIC), 2006) that recorded the highest proportion of employed residents in fifteen of the twenty high turnover SLAs was Public administration and safety. In contrast this industry division employed the sixth highest proportion of employed residents in Australia (6.9%).
At the industry subdivision level, Defence recorded the highest proportion of employed residents in ten of those fifteen SLAs. These ten SLAs, eight of which are in the Northern Territory, were:
- Duntroon (87.4% of employed residents employed in Defence)
- Litchfield (S)-Pt A (65.0%)
- City - Remainder (49.4%)
- Durack (29.8%)
- Gunn-Palmerston City (21.7%)
- Larrakeyah (18.4%)
- The Gardens (14.6%)
- City - Inner (14.0%)
- Driver (9.7%)
- Rosslea (6.0%).
The other five SLAs (of the fifteen with Public administration and safety as the top industry division of employment) were City, Kingston, Phillip and Belconnen Town Centre in the Australian Capital Territory and Nightcliff in the Northern Territory. In these SLAs, the ANZSIC subdivision that recorded the highest proportion of employed residents was Public administration; in particular Central government administration or State government administration.
For the remaining high turnover SLAs, the top industries of employment were:
- Mining: Leonora (S) (39.1%) and Jabiru (T) (37.2%)
- Accommodation and food services: Acton (31.7%)
- Health care and social assistance: Alice Springs (T) - Stuart (18.8%)
- Mining and Education and training: Meekatharra (S) (both 16.3%).
Housing
Most high turnover SLAs had high proportions of rented dwellings, which is indicative of a mobile population. More than 90% of the dwellings in City - Remainder, Jabiru (T), Duntroon and Acton were rented. With the exception of Litchfield (S)-Pt A, more than 45% of dwellings in the remaining sixteen high turnover SLAs were rented. The proportion of rented dwellings in Litchfield (S)-Pt A (29.5%) was similar to that for Australia (29.0%).
When looking at the types of dwellings occupied in each of the SLAs, twelve of the twenty high turnover SLAs had a higher proportion of flats, units or apartments, than the Australia rate of 13.1%. More than 50% of occupied private dwellings in Phillip, Rosslea, Larrakeyah, Kingston, City and City-Inner were flats, units or apartments: for City-Inner, City and Kingston this proportion was above 85%.
Demography
While the high turnover SLAs differed in many demographic characteristics, they did share some similarities in their age and sex structures with most displaying relatively young age profiles and, contrary to the picture at the Australia level, having more males than females (refer Table 1.3).
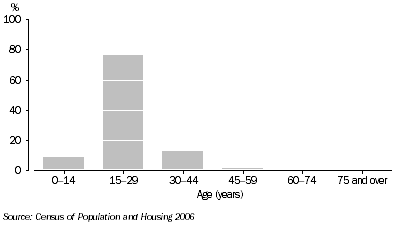
GRAPH 1.1. AGE GROUP, Duntroon
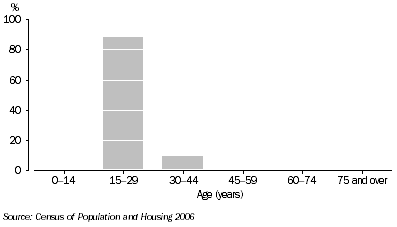
GRAPH 1.2. AGE GROUP, Acton
Litchfield (S)-Pt A and Duntroon had particularly high proportions of males (72.8% and 72.6% respectively). These SLAs both have strong military influences; Litchfield (S)-Pt A contains Robertson Barracks; and Duntroon contains the Royal Military College and Australian Defence Force Academy. The following SLAs also had a high proportion of males; City (60.9%), City - Inner (59.6%) and Jabiru (T) and Leonora (S), both 58.9%.
As well as containing high proportions of males, Litchfield (S)-Pt A and Duntroon had a high proportion of young males aged 15-29 years (60.3% of males living in Litchfield (S)-Pt A and 82.2% of males living in Duntroon). Acton and Belconnen Town Centre also had high proportions of their total males in this age group (87.2% and 45.2% respectively).
The 15-29 year age group was the most common age group in just over half (11) of the high turnover SLAs and all twenty high turnover SLAs had a higher proportion of 15-29 year olds than Australia (20.1%).
Of the populations within each SLA, Duntroon and Acton had the highest proportions of 15-29 year olds (1,290 persons or 76.6% and 1,600 persons or 88.6% respectively - see Graphs 1.1 and 1.2). It should be noted that there are tertiary institutions in these SLAs; the Australian National University in Acton and the Royal Military College and Australian Defence Force Academy in Duntroon. Litchfield (S)-Pt A (51.2%) and Belconnen Town Centre (47.4%) also had very high proportions of 15-29 year olds.
TABLE 1.3. HIGH POPULATION TURNOVER SLAs, By age (years) and sex - Australia |
| |
| State | SLA | 0 - 14 | 15 - 29 | 30 - 44 | 45 - 59 | 60 - 74 | 75 and over | Total | |
| |
| NT | City - Remainder | | | | | | | | |
| | Males | 355 | 418 | 289 | 103 | 35 | 5 | 1 205 | |
| | Females | 348 | 401 | 257 | 64 | 21 | 3 | 1 094 | |
| | Persons | 703 | 819 | 546 | 167 | 56 | 8 | 2 299 | |
| ACT | Duntroon | | | | | | | | |
| | Males | 69 | 1 004 | 134 | 15 | - | - | 1 222 | |
| | Females | 81 | 287 | 83 | 11 | - | - | 462 | |
| | Persons | 150 | 1 291 | 217 | 26 | - | - | 1 684 | |
| NT | Jabiru (T) | | | | | | | | |
| | Males | 166 | 117 | 207 | 146 | 29 | 4 | 669 | |
| | Females | 114 | 113 | 141 | 89 | 12 | - | 469 | |
| | Persons | 280 | 230 | 348 | 235 | 41 | 4 | 1 138 | |
| NT | Durack | | | | | | | | |
| | Males | 452 | 276 | 406 | 157 | 35 | 9 | 1 335 | |
| | Females | 436 | 299 | 417 | 154 | 37 | 7 | 1 350 | |
| | Persons | 888 | 575 | 823 | 311 | 72 | 16 | 2 685 | |
| NT | City - Inner | | | | | | | | |
| | Males | 90 | 441 | 404 | 335 | 167 | 43 | 1 480 | |
| | Females | 69 | 382 | 237 | 180 | 79 | 54 | 1 001 | |
| | Persons | 159 | 823 | 641 | 515 | 246 | 97 | 2 481 | |
| ACT | Acton | | | | | | | | |
| | Males | 3 | 778 | 97 | 6 | 8 | - | 892 | |
| | Females | 3 | 821 | 77 | 8 | - | 3 | 912 | |
| | Persons | 6 | 1 599 | 174 | 14 | 8 | 3 | 1 804 | |
| NT | Gunn-Palmerston City | | | | | | | | |
| | Males | 378 | 279 | 363 | 142 | 36 | 4 | 1 202 | |
| | Females | 361 | 278 | 351 | 156 | 24 | 8 | 1 178 | |
| | Persons | 739 | 557 | 714 | 298 | 60 | 12 | 2 380 | |
| NT | Litchfield (S) - Pt A | | | | | | | | |
| | Males | 58 | 543 | 158 | 103 | 30 | 8 | 900 | |
| | Females | 76 | 89 | 71 | 81 | 13 | 4 | 334 | |
| | Persons | 134 | 632 | 229 | 184 | 43 | 12 | 1 234 | |
| ACT | City | | | | | | | | |
| | Males | 6 | 169 | 138 | 93 | 17 | 15 | 438 | |
| | Females | 11 | 140 | 65 | 42 | 17 | 7 | 282 | |
| | Persons | 17 | 309 | 203 | 135 | 34 | 22 | 720 | |
| NT | Larrakeyah | | | | | | | | |
| | Males | 229 | 448 | 465 | 355 | 123 | 37 | 1 657 | |
| | Females | 218 | 376 | 375 | 293 | 83 | 33 | 1 378 | |
| | Persons | 447 | 824 | 840 | 648 | 206 | 70 | 3 035 | |
| ACT | Kingston | | | | | | | | |
| | Males | 66 | 468 | 363 | 184 | 72 | 46 | 1 199 | |
| | Females | 60 | 546 | 321 | 170 | 86 | 71 | 1 254 | |
| | Persons | 126 | 1 014 | 684 | 354 | 158 | 117 | 2 453 | |
| WA | Leonora (S) | | | | | | | | |
| | Males | 176 | 187 | 266 | 137 | 55 | 8 | 829 | |
| | Females | 165 | 115 | 164 | 103 | 27 | 7 | 581 | |
| | Persons | 341 | 302 | 430 | 240 | 82 | 15 | 1 410 | |
| NT | Alice Springs (T) - Stuart | | | | | | | | |
| | Males | 135 | 229 | 305 | 215 | 75 | 12 | 971 | |
| | Females | 164 | 312 | 228 | 172 | 58 | 13 | 947 | |
| | Persons | 299 | 541 | 533 | 387 | 133 | 25 | 1 918 | |
| ACT | Phillip | | | | | | | | |
| | Males | 57 | 325 | 273 | 167 | 61 | 34 | 917 | |
| | Females | 60 | 369 | 282 | 149 | 89 | 43 | 992 | |
| | Persons | 117 | 694 | 555 | 316 | 150 | 77 | 1 909 | |
| ACT | Belconnen Town Centre | | | | | | | | |
| | Males | 125 | 737 | 463 | 194 | 90 | 20 | 1 629 | |
| | Females | 116 | 710 | 286 | 191 | 88 | 35 | 1 426 | |
| | Persons | 241 | 1 447 | 749 | 385 | 178 | 55 | 3 055 | |
| NT | The Gardens | | | | | | | | |
| | Males | 24 | 84 | 79 | 62 | 37 | 24 | 310 | |
| | Females | 26 | 55 | 71 | 56 | 22 | 27 | 257 | |
| | Persons | 50 | 139 | 150 | 118 | 59 | 51 | 567 | |
| NT | Driver | | | | | | | | |
| | Males | 397 | 302 | 360 | 261 | 45 | 9 | 1 374 | |
| | Females | 384 | 319 | 353 | 223 | 53 | 11 | 1 343 | |
| | Persons | 781 | 621 | 713 | 484 | 98 | 20 | 2 717 | |
| Qld | Rosslea | | | | | | | | |
| | Males | 105 | 232 | 180 | 125 | 70 | 30 | 742 | |
| | Females | 87 | 240 | 134 | 112 | 75 | 57 | 705 | |
| | Persons | 192 | 472 | 314 | 237 | 145 | 87 | 1 447 | |
| WA | Meekatharra (S) | | | | | | | | |
| | Males | 150 | 118 | 128 | 124 | 60 | 10 | 590 | |
| | Females | 152 | 115 | 119 | 100 | 42 | 15 | 543 | |
| | Persons | 302 | 233 | 247 | 224 | 102 | 25 | 1 133 | |
| NT | Nightcliff | | | | | | | | |
| | Males | 289 | 354 | 396 | 448 | 188 | 39 | 1 714 | |
| | Females | 290 | 364 | 430 | 387 | 149 | 24 | 1 644 | |
| | Persons | 579 | 718 | 826 | 835 | 337 | 63 | 3 358 | |
| |
| - nil or rounded to zero (including null cells) |
| Note: This table is based on place of usual residence. Cells in this table have been randomly adjusted to avoid the release of confidential data. |
Characteristics of Statistical Local Areas with low population turnover
All twenty low turnover SLAs were in rural areas in either the Northern Territory (11) or Queensland (9) (see Table 1.2). Nine of the eleven low turnover SLAs in the Northern Territory were located in the northern areas. Similarly, eight of the nine low turnover SLAs in Queensland were also in the northern half of the state.
Employment
All low turnover SLAs, except for Yarrabah (S) and Pormpuraaw (S), had a labour force participation rate lower than Australia. The labour force participation rates for Yarrabah (S) and Pormpuraaw (S) were 70.6% and 66.9% respectively, compared with 64.6% for Australia. The SLAs with the lowest labour force participation rate were Numbulwar Numburindi (CGC) (20.9%), Angurugu (CGC) (21.1%) and Thamarrurr (CGC) (24.5%).
In seventeen of the twenty low turnover SLAs, the largest industry division of employment was Public administration and safety. In contrast, Public administration and safety was the sixth largest employing industry of employed residents in Australia (6.9%). The seventeen low turnover SLAs where this was the largest industry of employment were:
- Kowanyama (S) (78.4%)
- Yarrabah (S) (77.0%)
- Napranum (S) (70.7%)
- Cherbourg (S) (70.5%)
- Pormpuraaw (S) (68.2%)
- Aurukun (S) (65.5%)
- Angurugu (CGC) (60.4%)
- East Arnhem - Bal (54.4%)
- Kunbarllanjnja (CGC) (53.2%)
- Numbulwar Numburindi (CGC) (52.6%)
- Mornington (S) (52.0%)
- Nyirranggulung Mardrulk Ngadberre (CGC) (45.7%)
- West Arnhem (45.0%)
- Tanami (44.6%)
- Tiwi Islands (CGC) (44.2%)
- Yugul Mangi (CGC) (43.1%)
- Thamarrurr (CGC) (39.8%)
For the remaining three low turnover SLAs, the industry division that recorded the highest proportion of employed residents was Health care and social assistance. These SLAs were Doomadgee (S) (37.8%), Palm Island (S) (32.7%) and Ltyentye Purte (CGC) (29.1%).
Interestingly, with the exception of Palm Island (S), the top industry subdivision for all twenty low turnover SLAs was Public administration. The top industry subdivision for Palm Island (S) was Social assistance services, followed by Public administration.
The major group occupation category (using the
Australian and New Zealand Standard Classification of Occupations (ANZSCO), 2006) that recorded the largest proportion of employed residents in nineteen of the twenty low turnover SLAs was Labourers. The proportions varied from 23.7% in Thamarrurr (CGC) to 61.6% in Yarrabah (S), compared with 10.7% for Australia. The exception was Numbulwar Numburindi (CGC) where the occupation category that recorded the highest proportion of residents was Professionals (29.7%), followed closely by Labourers (27.0%).
Income
Less than 10% of residents aged 15 years and over in all twenty low turnover SLAs earned $1,000 or more per week, compared with 19.7% of residents aged 15 years and over in Australia.
Housing
Most of the twenty low turnover SLAs had high proportions of rented dwellings. With the exception of Aurukun (S), more than 89% of occupied private dwellings in all twenty low turnover SLAs were rented, compared with 29.0% of occupied private dwellings in Australia. Just over 60% of occupied private dwellings in Aurukun (S) were rented. Of the rented dwellings in each of the twenty low turnover SLAs, most were being rented from a Housing co-operative, the community or a church group (the proportion varied from 59.5% to 94.7%). The high proportions of rented dwellings in the twenty low turnover SLAs may reflect the types of tenure available on traditional Indigenous lands.
Demography
All twenty SLAs with the lowest turnover had high proportions of Indigenous people. These proportions varied from 89.2% in Tanami to 97.8% in Yarrabah (S), compared with 2.4% in Australia.
Generally the demographic characteristics of age and sex for most low turnover SLAs were similar. The most common age group in all low turnover SLAs was 0-14 years and each of the low turnover SLAs had higher proportions of people in this age group than Australia (19.8%). In general, within each of the low turnover SLAs, there were only small differences in the number of males and females (see Table 1.4).
Although the demographics of each SLA in the low turnover group were similar (see Table 1.4), some notable differences were observed:
- Kowanyama (S) had the lowest proportion of males (46.5%) of all low turnover SLAs.
- A very high proportion of residents in Cherbourg (S) and Thamarrurr (CGC) were aged 0-14 years (41.6% and 39.3% respectively).
TABLE 1.4. LOW POPULATION TURNOVER SLAs, By age (years) and sex - Australia |
| |
| State | SLA | 0 - 14 | 15 - 29 | 30 - 44 | 45 - 59 | 60 - 74 | 75 and over | Total | |
| |
| NT | Angurugu (CGC) | | | | | | | | |
| | Males | 144 | 95 | 102 | 30 | 11 | 6 | 388 | |
| | Females | 144 | 125 | 92 | 50 | 13 | - | 424 | |
| | Persons | 288 | 220 | 194 | 80 | 24 | 6 | 812 | |
| NT | East Arnhem - Bal | | | | | | | | |
| | Males | 1 090 | 946 | 670 | 417 | 110 | 14 | 3 247 | |
| | Females | 973 | 942 | 752 | 421 | 159 | 28 | 3 275 | |
| | Persons | 2 063 | 1 888 | 1 422 | 838 | 269 | 42 | 6 522 | |
| NT | West Arnhem | | | | | | | | |
| | Males | 606 | 429 | 394 | 190 | 60 | 19 | 1 698 | |
| | Females | 560 | 472 | 340 | 189 | 58 | 17 | 1 636 | |
| | Persons | 1 166 | 901 | 734 | 379 | 118 | 36 | 3 334 | |
| Qld | Yarrabah (S) | | | | | | | | |
| | Males | 443 | 307 | 232 | 138 | 33 | 10 | 1 163 | |
| | Females | 445 | 311 | 265 | 129 | 48 | 12 | 1 210 | |
| | Persons | 888 | 618 | 497 | 267 | 81 | 22 | 2 373 | |
| NT | Thamarrurr (CGC) | | | | | | | | |
| | Males | 382 | 256 | 157 | 89 | 32 | 4 | 920 | |
| | Females | 378 | 319 | 173 | 82 | 37 | 20 | 1 009 | |
| | Persons | 760 | 575 | 330 | 171 | 69 | 24 | 1 929 | |
| NT | Yugul Mangi (CGC) | | | | | | | | |
| | Males | 311 | 235 | 150 | 93 | 29 | 10 | 828 | |
| | Females | 295 | 233 | 182 | 73 | 26 | 3 | 812 | |
| | Persons | 606 | 468 | 332 | 166 | 55 | 13 | 1 640 | |
| Qld | Aurukun (S) | | | | | | | | |
| | Males | 173 | 121 | 125 | 67 | 15 | 3 | 504 | |
| | Females | 169 | 131 | 139 | 70 | 29 | 3 | 541 | |
| | Persons | 342 | 252 | 264 | 137 | 44 | 6 | 1 045 | |
| NT | Numbulwar Numburindi (CGC) | | | | | | | | |
| | Males | 125 | 84 | 75 | 40 | 16 | 3 | 343 | |
| | Females | 91 | 93 | 88 | 34 | 27 | 5 | 338 | |
| | Persons | 216 | 177 | 163 | 74 | 43 | 8 | 681 | |
| Qld | Kowanyama (S) | | | | | | | | |
| | Males | 139 | 107 | 119 | 74 | 26 | 11 | 476 | |
| | Females | 149 | 140 | 143 | 79 | 25 | 9 | 545 | |
| | Persons | 288 | 247 | 262 | 153 | 51 | 20 | 1 021 | |
| NT | Kunbarllanjnja (CGC) | | | | | | | | |
| | Males | 136 | 125 | 110 | 61 | 12 | - | 444 | |
| | Females | 126 | 132 | 111 | 46 | 19 | 3 | 437 | |
| | Persons | 262 | 257 | 221 | 107 | 31 | 3 | 881 | |
| Qld | Palm Island (S) | | | | | | | | |
| | Males | 364 | 236 | 239 | 111 | 33 | 6 | 989 | |
| | Females | 345 | 261 | 225 | 134 | 22 | 4 | 991 | |
| | Persons | 709 | 497 | 464 | 245 | 55 | 10 | 1 980 | |
| NT | Tiwi Islands (CGC) | | | | | | | | |
| | Males | 328 | 316 | 258 | 146 | 42 | 4 | 1 094 | |
| | Females | 305 | 271 | 251 | 167 | 31 | 9 | 1 034 | |
| | Persons | 633 | 587 | 509 | 313 | 73 | 13 | 2 128 | |
| Qld | Mornington (S) | | | | | | | | |
| | Males | 174 | 113 | 115 | 80 | 35 | 6 | 523 | |
| | Females | 152 | 133 | 114 | 66 | 33 | 10 | 508 | |
| | Persons | 326 | 246 | 229 | 146 | 68 | 16 | 1 031 | |
| Qld | Napranum (S) | | | | | | | | |
| | Males | 155 | 97 | 87 | 66 | 20 | - | 425 | |
| | Females | 130 | 114 | 91 | 53 | 21 | 5 | 414 | |
| | Persons | 285 | 211 | 178 | 119 | 41 | 5 | 839 | |
| Qld | Cherbourg (S) | | | | | | | | |
| | Males | 237 | 132 | 84 | 66 | 27 | 3 | 549 | |
| | Females | 234 | 146 | 105 | 69 | 23 | 3 | 580 | |
| | Persons | 471 | 278 | 189 | 135 | 50 | 6 | 1 129 | |
| Qld | Pormpuraaw (S) | | | | | | | | |
| | Males | 83 | 47 | 89 | 64 | 25 | 3 | 311 | |
| | Females | 79 | 70 | 69 | 51 | 16 | 3 | 288 | |
| | Persons | 162 | 117 | 158 | 115 | 41 | 6 | 599 | |
| Qld | Doomadgee (S) | | | | | | | | |
| | Males | 232 | 132 | 105 | 60 | 16 | 3 | 548 | |
| | Females | 178 | 159 | 110 | 55 | 23 | 9 | 534 | |
| | Persons | 410 | 291 | 215 | 115 | 39 | 12 | 1 082 | |
| NT | Ltyentye Purte (CGC) | | | | | | | | |
| | Males | 97 | 79 | 53 | 21 | 9 | - | 259 | |
| | Females | 96 | 80 | 54 | 35 | 14 | 3 | 282 | |
| | Persons | 193 | 159 | 107 | 56 | 23 | 3 | 541 | |
| NT | Tanami | | | | | | | | |
| | Males | 384 | 364 | 241 | 164 | 42 | 6 | 1 201 | |
| | Females | 363 | 365 | 259 | 168 | 72 | 12 | 1 239 | |
| | Persons | 747 | 729 | 500 | 332 | 114 | 18 | 2 440 | |
| NT | Nyirranggulung Mardrulk Ngadberre (CGC) | | | | | | | | |
| | Males | 140 | 134 | 114 | 63 | 12 | - | 463 | |
| | Females | 155 | 140 | 101 | 58 | 15 | 6 | 475 | |
| | Persons | 295 | 274 | 215 | 121 | 27 | 6 | 938 | |
| |
| - nil or rounded to zero (including null cells) |
| Note: This table is based on place of usual residence. Cells in this table have been have been randomly adjusted to avoid the release of confidential data. |
Please note: All data presented in this publication relate to person or dwelling characteristics at the time of the 2006 Census. As arrivals and departures may have moved at any time in the five years to the 2006 Census their characteristics could have been different at the time of their migration. The data presented also only captures a person's place of usual residence at the 2006 Census and five years prior to the Census. People could have moved residence numerous times between these time periods. Arrivals estimates exclude people who did not state where they lived five years ago, and those who were under the age of 5 at the time of the 2006 Census. In addition to those exclusions, estimates of departures also exclude overseas departures (as these people were not enumerated in the Census). To be consistent with the conceptual basis of the arrivals and departures estimates, the adjusted Census count used in calculating population turnover also excludes 0-4 year olds and people who did not state where they lived five years ago.
 Print Page
 Print All