 WATER
WATER
RAINFALL
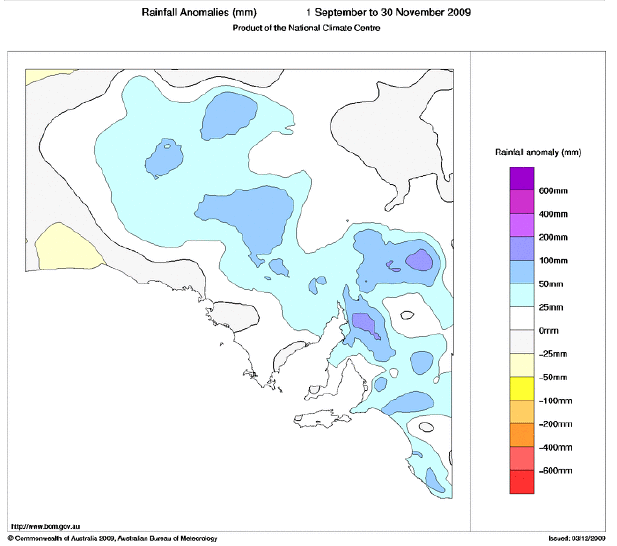
According to the Bureau of Meteorology's Seasonal Climate Summary for South Australia, Spring 2009 was the wettest spring since 2005. When averaged across the South Australian agricultural areas as a whole, Spring 2009 has been the 25th driest since 1900.
Spring rainfall totals over South Australia were generally near average in the agricultural areas, tending above average across the pastoral areas. This was made up of generally above average rainfall in September, below average in October and generally well above average November rainfall after a dry first three weeks of the month.
Rainfall totals in the pastoral areas were very variable but generally ranging from 50 to 100mm. Erudina in the North East Pastoral district recorded 154.6mm as the highest reading in the pastoral districts. This was also the highest total spring rainfall recorded at this location since 1920. Totals in the agricultural areas were generally between 100 to 200mm, with totals widely exceeding 200mm about the Mount Lofty and Flinders Ranges, and several locations exceeding 300mm. Many of the western agricultural districts experienced totals in the 50 to 100mm range. Piccadilly in the Adelaide Hills recorded the highest rainfall total in the state this spring with 317.6mm.

Source
: 3-monthly rainfall anomalies for South Australia, Australian Bureau of Meteorology
RESERVOIR LEVELS
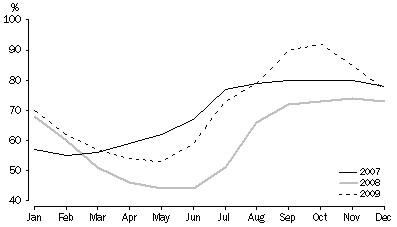
The total water storage in Adelaide's reservoirs at the end of December 2009 was 77% of capacity, compared to 73% at the same time in 2008. According to SA Water, in 2009 Adelaide consumed 137.4 gigalitres (GL) of water. Although this is slightly higher than consumption for 2008, water consumption continues to be below the target for enhanced level three water restrictions. Over the course of 2009 approximately 125GL of rainfall entered Adelaide's reservoirs, with 50GL of this received via good spring rainfalls. As a result only 36GL of water was pumped from the River Murray to supplement supply in 2009, compared with 97GL pumped in 2008.
TOTAL RESERVOIR STORAGE, As a percentage of capacity, Adelaide

Source:
SA Water daily reservoir levels
 Print Page
 Print All