DWELLING UNITS APPROVED BY TYPE OF DWELLING 2009–10
STATES AND TERRITORIES
The number of dwelling units approved in the States and Territories during 2009-10 is shown in the table below for each type of dwelling category.
 |  | NSW | Vic. | Qld | SA | WA | Tas. | NT | ACT | Aust. |
 |  | no. | no. | no. | no. | no. | no. | no. | no. | no. |
|
| New houses | 17 048 | 39 058 | 22 767 | 10 012 | 20 375 | 2 562 | 760 | 2 208 | 114 790 |
| New semidetached, row or terrace houses, townhouses etc of: |  |  |  |  |  |  |  |  |  |
 | One storey | 3 521 | 3 027 | 1 677 | 1 279 | 2 647 | 484 | 296 | 369 | 13 300 |
 | Two or more storeys | 2 509 | 3 806 | 2 465 | 834 | 644 | 66 | 25 | 463 | 10 812 |
 | Total | 6 030 | 6 833 | 4 142 | 2 113 | 3 291 | 550 | 321 | 832 | 24 112 |
| New flats, units, apartments in a building of: |  |  |  |  |  |  |  |  |  |
 | One or two storeys | 3 517 | 1 578 | 2 580 | 286 | 528 | 126 | 72 | 308 | 8 995 |
 | Three storeys | 1 058 | 1 056 | 1 060 | 108 | 127 | - | - | 426 | 3 835 |
 | Four or more storeys | 5 152 | 7 590 | 3 111 | 73 | 1 000 | - | 156 | 763 | 17 845 |
 | Total | 9 727 | 10 224 | 6 751 | 467 | 1 655 | 126 | 228 | 1 497 | 30 675 |
| Total new other residential building | 15 757 | 17 057 | 10 893 | 2 580 | 4 946 | 676 | 549 | 2 329 | 54 787 |
| Other |  |  |  |  |  |  |  |  |  |
 | Alterations and additions to residential building | 94 | 84 | 35 | 4 | 14 | 4 | 15 | - | 250 |
 | Conversion | 242 | 98 | 11 | 7 | 3 | 4 | 10 | - | 375 |
 | Non-residential building | 63 | 83 | 11 | 7 | 31 | 1 | 10 | 2 | 208 |
| Total building | 33 204 | 56 380 | 33 717 | 12 610 | 25 369 | 3 247 | 1 344 | 4 539 | 170 410 |
|
| - nil or rounded to zero (including null cells) |
SUMMARY COMMENT
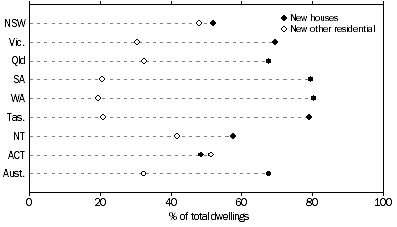
The estimated number of dwelling units approved in Australia rose from 133,088 in 2008-09 to 170,410 in 2009-10, a rise of 28.0%. Of the estimate of total dwelling units approved in 2009-10, 114,790 (67.4%) were new houses whereas in 2008-09 houses accounted for 70.5% of dwelling units approved. The proportion of total new other residential building rose from 28.7% in 2008-09 to 32.2% in 2009-10, driven by rising proportions in New South Wales and Victoria, which rose from 42.2% to 47.5% and 26.3% to 30.3% respectively.
DWELLINGS APPROVED, States and territories
- By type of dwelling
- 2009-10

 Quality Declaration
  Print Page
 Print All