5673.0.55.003 - Wage and Salary Earner Statistics for Small Areas, Time Series, 2003-04 to 2008-09  Quality Declaration
Quality Declaration ARCHIVED ISSUE Released at 11:30 AM (CANBERRA TIME) 12/08/2011
Page tools:
 Print Page Print Page
 Print All Print All
| |||||||||||||||||||||||||||||||||||||||||||||||||||||||||||||||||||||||||||||||||||||||||||||||||||||||||||||||||||||||||||||||||||||||||||||||||||||||||||||||||||||||||||||||||||||||
On this page: Top Average Wage and Salary Income Regions, 2008-09 Average Wage and Salary Incomes in the Melbourne Statistical Division, 2008-09 Number of Wage and Salary Earners by Income Range, 2003-04 to 2008-09 TOP AVERAGE WAGE AND SALARY INCOME REGIONS, 2008-09 This section focuses on the five SLAs in Melbourne Statistical Division (SD) and Victoria - Balance with the highest average Wage and salary incomes in 2008-09. TOP AVERAGE WAGES AND SALARIES, VICTORIA, 2008-09
The SLAs with the highest average Wage and salary incomes in Melbourne SD were located in areas around Port Philip Bay (incorporating the suburbs of Brighton, Port Melbourne and Albert Park) and the eastern suburbs of Prahran, Kew and Malvern. Outside the Melbourne SD, the SLA with the highest average Wage and salary income was the Macedon Ranges (S) – Balance with $50,610. This region offers a semi-rural lifestyle within commuting distance of Melbourne. The SLA of Newtown is an inner residential suburb of Geelong, which is the largest provincial centre in Victoria and a manufacturing, transportation and service hub. The SLA of Latrobe (C) - Traralgon is located in the State's Latrobe Valley, home of most of Victoria's power generation facilities and a paper mill. AVERAGE WAGE AND SALARY INCOMES IN THE MELBOURNE STATISTICAL DIVISION, 2008-09 The following map shows geographical variations in average Wage and salary incomes within the Melbourne Statistical Division in 2008-09. AVERAGE INCOME FROM WAGES AND SALARIES - By Statistical Local Area, Melbourne Statistical Division, 2008-09 NUMBER OF WAGE AND SALARY EARNERS BY INCOME RANGE, 2003-04 TO 2008-09 The following animated graph shows the number of Wage and salary earners (male and female) by income range in each financial year, 2003-04 to 2008-09 (click on the play button to move through the years) . To find data for other states or territories, or for Australia, use the 'Switch Dataset' box to make your selection. This will be replaced by the swf. 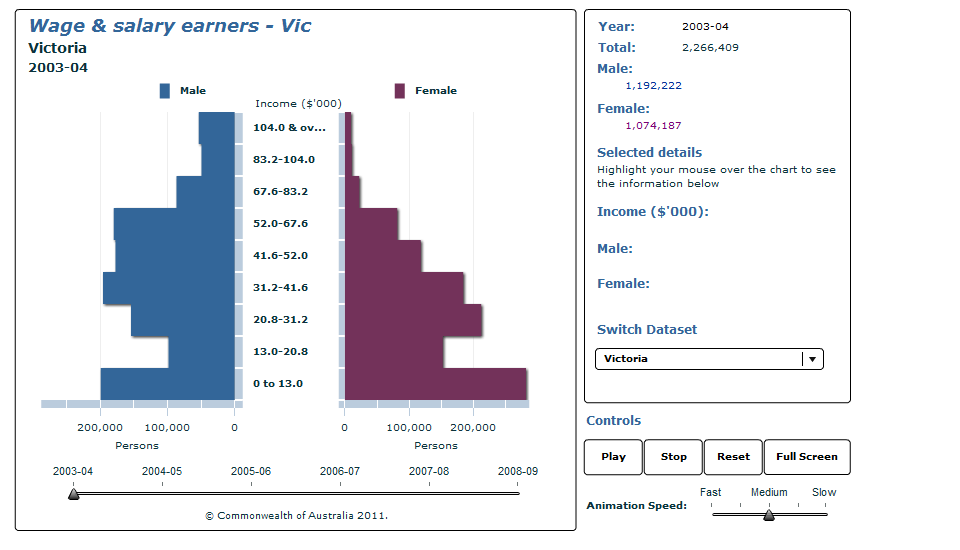 Source(s): Victoria; New South Wales; Queensland; South Australia; Western Australia; Tasmania; Northern Territory; Australian Capital Territory; Australia Document Selection These documents will be presented in a new window.
|
|||||||||||||||||||||||||||||||||||||||||||||||||||||||||||||||||||||||||||||||||||||||||||||||||||||||||||||||||||||||||||||||||||||||||||||||||||||||||||||||||||||||||||||||||||||||
