LABOUR FORCE
Age groups
Occupation
Industry
Usual hours
Average Weekly Earnings
Underutilisation rate
Age groups
EMPLOYED PERSONS(a), by age |
|  |
| December 2003 | December 2007 | December 2008 | |
| Full time | Part time | Full time | Part time | Full time | Part time | |
| Age group (years) | '000 | % | '000 | % | '000 | % | '000 | % | '000 | % | '000 | % | |
Australian Capital Territory | |
| |
| 15 - 24 | 18.1 | 14.1 | 16.6 | 35.6 | 19.8 | 13.9 | 16.3 | 35.7 | 21.0 | 14.6 | 14.8 | 30.8 | |
| 25 - 34 | 34.4 | 26.8 | 6.7 | 14.3 | 37.2 | 26.1 | 6.2 | 13.6 | 38.7 | 26.9 | 7.5 | 15.6 | |
| 35 - 44 | 30.6 | 23.9 | 9.4 | 20.0 | 33.6 | 23.6 | 8.5 | 18.7 | 33.2 | 23.1 | 9.0 | 18.8 | |
| 45 - 54 | 31.5 | 24.6 | 7.9 | 16.9 | 33.7 | 23.7 | 6.7 | 14.6 | 32.8 | 22.8 | 7.9 | 16.4 | |
| 55 - 64 | 12.4 | 9.7 | 4.9 | 10.5 | 17.0 | 12.0 | 6.0 | 13.1 | 16.5 | 11.5 | 7.0 | 14.7 | |
| 65 and over | 1.0 | 0.8 | 1.3 | 2.8 | 1.1 | 0.8 | 2.0 | 4.3 | 1.5 | 1.0 | 1.8 | 3.8 | |
| Total | 128.0 | 100.0 | 46.8 | 100.0 | 142.4 | 100.0 | 45.7 | 100.0 | 143.6 | 100.0 | 48.1 | 100.0 | |
Australia | |
| |
| 15 - 24 | 921.9 | 13.6 | 775.1 | 28.6 | 1 040.3 | 13.9 | 818.6 | 27.6 | 1 049.0 | 13.7 | 840.7 | 27.6 | |
| 25 - 34 | 1 740.8 | 25.7 | 445.5 | 16.4 | 1 830.5 | 24.4 | 439.0 | 14.8 | 1 881.6 | 24.5 | 448.5 | 14.7 | |
| 35 - 44 | 1 723.4 | 25.5 | 589.8 | 21.7 | 1 820.4 | 24.3 | 624.1 | 21.1 | 1 837.3 | 24.0 | 632.5 | 20.8 | |
| 45 - 54 | 1 596.3 | 23.6 | 508.8 | 18.8 | 1 764.5 | 23.5 | 558.0 | 18.8 | 1 807.7 | 23.6 | 558.2 | 18.3 | |
| 55 - 64 | 713.3 | 10.5 | 305.8 | 11.3 | 934.1 | 12.4 | 397.6 | 13.4 | 965.4 | 12.6 | 424.8 | 13.9 | |
| 65 and over | 72.5 | 1.1 | 86.9 | 3.2 | 116.2 | 1.5 | 127.1 | 4.3 | 125.6 | 1.6 | 141.3 | 4.6 | |
| Total | 6 768.3 | 100.0 | 2 711.9 | 100.0 | 7 505.9 | 100.0 | 2 964.3 | 100.0 | 7 666.5 | 100.0 | 3 045.9 | 100.0 | |
| |
| (a) Annual averages. |
| Source: Labour Force, Australia, Detailed - Electronic Delivery (cat. no. 6291.0.55.001). |
Employed full time
The average number of Australian Capital Territory (ACT) usual residents employed full time in the 12 months ending December 2008 was 143,600, similar to the previous year (142,400), and up 12% (15,600) from the 12 months ending December 2003 (128,000). The average number of people employed full time in Australia (Aust.) in the 12 months ending December 2008 was 7.7 million, up 2% (160,600) from the year to December 2007 (7.5 million), and up 13% (898,200) from the year to December 2003 (6.8 million).
Key highlights for the ACT:
- From the year ended December 2003 to the year ended December 2007 the number of employed persons in the 55-64 year age group experienced the strongest proportionate growth of all age groups, up more than two percentage points (from 10.0% to 12.0% of all employees). In the following year the proportion of employees in this age group eased. Nationally, the proportion of employees in the 55-64 year age group also experienced the strongest growth.
- Employed persons in the 35-44 year age group: in contrast to the 1.5 percentage point drop nationally from year ended December 2003 to December 2008, the proportion of ACT resident employees fell by only about half this amount.
Employed part time
The average number of ACT usual residents employed part time in the 12 months ending December 2008 was 48,100, up 5% from the previous year (45,700). Nationally, the average number of people employed part time in 2008 was 3.0 million, up 3% (81,600) from 2007.
Key highlights for the ACT:
- The proportion of people employed part time, aged 15-24 years, has been consistently higher than any other age group, in the ACT and nationally. However, it has been declining in the ACT, from 36% in 2003 to 31% in 2008. Nationally the fall was only one percentage point (29% to 28% between 2003 and 2008).
- The 55-64 years age group experienced the strongest increase, from 11% of total part-time employed persons to 15% of total part-time employed persons between 2003 and 2008. Nationally, there was also a proportionate rise in this age group, although not as strong (11% to 14%).
Occupation
EMPLOYED PERSONS(a): Australian Capital Territory |
| |
| November 2003 | November 2008 | |
| Occupation major group(b) | '000 | % | '000 | % | |
| |
| Managers and Administrators | 14.2 | 8.2 | 20.7 | 10.8 | |
| Professionals | 52.3 | 30.0 | 54.4 | 28.4 | |
| Associate Professionals | 22.2 | 12.8 | 30.9 | 16.2 | |
| Tradespersons and Related Workers | 14.9 | 8.5 | 15.1 | 7.9 | |
| Advanced Clerical and Service Workers | 5.2 | 3.0 | 6.1 | 3.2 | |
| Intermediate Clerical, Sales and Service Workers | 34.3 | 19.7 | 35.5 | 18.5 | |
| Intermediate Production and Transport Workers | 6.8 | 3.9 | 5.8 | 3.1 | |
| Elementary Clerical, Sales and Service Workers | 16.4 | 9.4 | 15.0 | 7.8 | |
| Labourers and Related Workers | 8.0 | 4.6 | 7.7 | 4.0 | |
| Total | 174.4 | 100.0 | 191.4 | 100.0 | |
| |
| (a) Annual average of quarterly data. |
| (b) Classified according to the Australian Standard Classification of Occupations (ASCO), Second Edition, 1997. |
| Source: Labour Force, Australia, Detailed, Quarterly (cat. no 6291.0.55.003). |
Based on occupation by major group,
Professionals made up the largest proportion of employed persons in the ACT for the year ending November 2008 (28%). The group with the largest increase over the five years (2003 to 2008) was
Associate Professionals, with 8,700 more people employed in the year ending November 2008 than in 2003. The group with the largest percentage increase was
Managers and Administrators, up (46% or 6,500 persons). The group experiencing the largest percentage decrease was
Intermediate Production and
Transport Workers, falling 15% (1,000 persons) from the year ending November 2003.
Industry
EMPLOYED PERSONS(a), by industry: Australian Capital Territory |
| |
| November 2003 | November 2008 | |
| Industry division(b) | '000 | % | '000 | % | |
| |
| Agriculture, Forestry and Fishing | 0.5 | 0.3 | 0.4 | 0.2 | |
| Mining | - | - | - | - | |
| Manufacturing | 6.1 | 3.5 | 4.2 | 2.2 | |
| Electricity, Gas and Water Supply | 1.3 | 0.7 | 1.1 | 0.6 | |
| Construction | 9.9 | 5.7 | 14.8 | 7.7 | |
| Wholesale Trade | 2.5 | 1.5 | 2.8 | 1.4 | |
| Retail Trade | 21.4 | 12.3 | 18.8 | 9.8 | |
| Accommodation, Cafes and Restaurants | 8.8 | 5.1 | 9.1 | 4.8 | |
| Transport and Storage | 4.0 | 2.3 | 4.7 | 2.4 | |
| Communication Services | 3.4 | 1.9 | 2.5 | 1.3 | |
| Finance and Insurance | 2.5 | 1.4 | 5.0 | 2.6 | |
| Property and Business Services | 24.8 | 14.2 | 26.7 | 13.9 | |
| Government Administration and Defence | 44.0 | 25.2 | 52.4 | 27.4 | |
| Education | 14.7 | 8.4 | 14.8 | 7.7 | |
| Health and Community Services | 15.2 | 8.7 | 16.6 | 8.7 | |
| Cultural and Recreational Services | 6.8 | 3.9 | 8.5 | 4.4 | |
| Personal and Other Services | 8.4 | 4.8 | 9.1 | 4.7 | |
| Total | 174.4 | 100.0 | 191.4 | 100.0 | |
| |
| - nil or rounded to zero (including null cells) |
| (a) Annual average of quarterly data. |
| (b) Classified according to the Australian and New Zealand Standard Industrial Classification (ANZSIC), 1993 edition. |
| Source: Labour Force, Australia, Detailed, Quarterly (cat. no. 6291.0.55.003). |
Based on employment by industry division the largest employer in the ACT for the 12 months ending November quarter 2008 was
Government Administration and
Defence (52,400). This was also the industry with the largest increase between year ending November 2003 and year ending November 2008 (8,400 persons). The industry with the largest percentage increase was
Finance and Insurance (100% or 2,500 persons).
Manufacturing had the largest percentage decrease (-31% or -1,900 persons).
Usual hours
EMPLOYED PERSONS(a), by usual hours worked |
| |
| December 2008 | |
| Full time | Part time | |
| '000 | % | '000 | % | |
Australian Capital Territory | |
| |
| 0 hours | - | - | 0.3 | 0.6 | |
| 1-15 hours | 0.2 | 0.2 | 19.4 | 40.4 | |
| 16-29 hours | 0.9 | 0.6 | 19.4 | 40.3 | |
| 30-34 hours | 1.1 | 0.7 | 9.0 | 18.7 | |
| 35-39 hours | 53.4 | 37.2 | - | - | |
| 40 hours | 40.3 | 28.1 | - | - | |
| 41-44 hours | 8.1 | 5.6 | - | - | |
| 45-49 hours | 16.2 | 11.3 | - | - | |
| 50-59 hours | 15.9 | 11.1 | - | - | |
| 60 or more hours | 7.5 | 5.2 | - | - | |
| Total | 143.6 | 100.0 | 48.1 | 100.0 | |
Australia | |
| |
| 0 hours | 3.0 | - | 22.8 | 0.7 | |
| 1-15 hours | 13.8 | 0.2 | 1 159.3 | 38.1 | |
| 16-29 hours | 50.1 | 0.7 | 1 320.4 | 43.3 | |
| 30-34 hours | 71.9 | 0.9 | 543.4 | 17.8 | |
| 35-39 hours | 2 279.2 | 29.7 | - | - | |
| 40 hours | 2 272.6 | 29.6 | - | - | |
| 41-44 hours | 330.5 | 4.3 | - | - | |
| 45-49 hours | 835.4 | 10.9 | - | - | |
| 50-59 hours | 1 052.4 | 13.7 | - | - | |
| 60 or more hours | 757.6 | 9.9 | - | - | |
| Total | 7 666.5 | 100.0 | 3 045.9 | 100.0 | |
| |
| - nil or rounded to zero (including null cells) |
| (a) Annual average monthly data. |
| Source: Labour Force, Australia, Detailed - Electronic Delivery (cat. no. 6291.0.55.001). |
Usual hours worked by employed persons, on average, during the 12 months ending September 2008 differed between the ACT and Australia. A smaller proportion of full-time workers in the ACT worked 41 hours or more per week (33%) compared with Aust. (39%), while a larger proportion worked between 35-40 hours than the national average (ACT 65%, Aust. 59%). In the 12 months ending December 2008 the most common hours usually worked by people employed part time in the ACT were 1-15 hours or 16-29 hours both accounted for 40%. Nationally, the largest proportion of part-time employed people worked 16-29 hours per week (43%).
Average weekly earnings
Average weekly ordinary time earnings: Trend |
| |
| | August 2007 | August 2008 | |
Australian Capital Territory | |
| |
| Earnings | $ | 1 029.7 | 1 086.5 | |
| Percentage change from previous quarter | % | 0.8 | 1.3 | |
| Percentage change from corresponding quarter of previous year | % | -1.2 | 5.5 | |
Australia | |
| |
| Earnings | $ | 869.3 | 897.9 | |
| Percentage change from previous quarter | % | 0.9 | 0.9 | |
| Percentage change from corresponding quarter of previous year | % | 4.6 | 3.3 | |
| |
| Source: Average Weekly Earnings, Australia (cat. no. 6302.0). |
In trend terms, Average Weekly Earnings (AWE) for the ACT in August 2008 were $189 higher than the national average of $898 at $1,087. This was an increase of 1.3% from May 2008. AWE increased 5.5% between August 2007 and August 2008 for the ACT, from $1,030 to $1,087. The increase over the same period for Aust. was 3.3%, bringing AWE from ($869 to $898).
Underutilisation rate
LABOUR FORCE UNDERUTILISATION RATE(a)(b): Trend
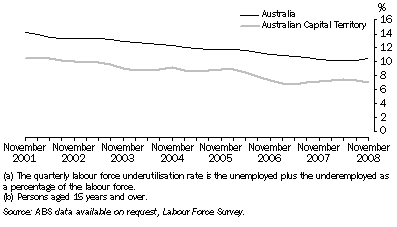
In trend terms, the underutilisation rates for the ACT and Aust. declined gradually between November 2001 and November 2008. The national underutilisation rate fell by 3.7 percentage points, from 14.2% in November 2001 to 10.5% in November 2008. The ACT underutilisation rate fell by 3.5 percentage points, from 10.4% to 6.9% over the same period. The ACT underutilisation rate was generally between 3 and 4 percentage points lower than the national rate over the period.