 SECTION 4 STATE ACCOUNTS
State Final Demand
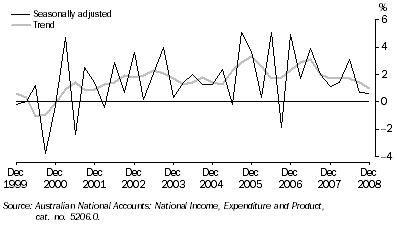
- In seasonally adjusted terms, Western Australia's state final demand grew 0.6% in the December quarter 2008.
- Growth in final consumption expenditure for the quarter was minimal for general government and slightly down for households but was stronger for private gross fixed capital formation (up 1.7% seasonally adjusted).
11 COMPONENTS OF STATE FINAL DEMAND, Chain volume measures(a) |
|
 |  | 2007 | 2008 | Percentage change |
 |  | December | September | December | Previous quarter | Same quarter previous year |
 |  | $m | $m | $m | % | % |
TREND |
|
| Final consumption expenditure |  |  |  |  |  |
 | General government | 4 303 | 4 392 | 4 407 | 0.3 | 2.4 |
 | Households | 15 029 | 15 375 | 15 469 | 0.6 | 2.9 |
 | Total final consumption expenditure | 19 332 | 19 767 | 19 876 | 0.6 | 2.8 |
| Private gross fixed capital formation | 12 573 | 13 669 | 13 865 | 1.4 | 10.3 |
| Public gross fixed capital formation | np | np | np | np | np |
| State final demand | 33 241 | 34 865 | 35 211 | 1.0 | 5.9 |
SEASONALLY ADJUSTED |
|
| Final consumption expenditure |  |  |  |  |  |
 | General government | 4 323 | 4 399 | 4 405 | 0.1 | 1.9 |
 | Households | 15 027 | 15 466 | 15 439 | -0.2 | 2.7 |
 | Total final consumption expenditure | 19 350 | 19 865 | 19 844 | -0.1 | 2.6 |
| Private gross fixed capital formation | 12 460 | 13 555 | 13 786 | 1.7 | 10.6 |
| Public gross fixed capital formation | 1 339 | 1 453 | 1 453 | - | 8.5 |
| State final demand | 33 150 | 34 873 | 35 083 | 0.6 | 5.8 |
|
| - nil or rounded to zero (including null cells) |
| np not available for publication but included in totals where applicable, unless otherwise indicated |
| (a) Reference year for chain volume measures is 2006-07. |
| Source: Australian National Accounts: National Income, Expenditure and Product, cat. no. 5206.0. |
- Western Australia's state final demand (trend chain volume measures) rose 1.0% to just over $35 billion in the December quarter 2008 following 1.4% growth in the previous quarter. Nationally, domestic final demand grew 0.3% in the December quarter 2008.
- Growth in the December quarter was second highest amongst the states and territories, with Northern Territory having the highest growth of 1.8%.
STATE FINAL DEMAND, Chain volume measures
- Change from previous quarter

 Print Page
 Print All