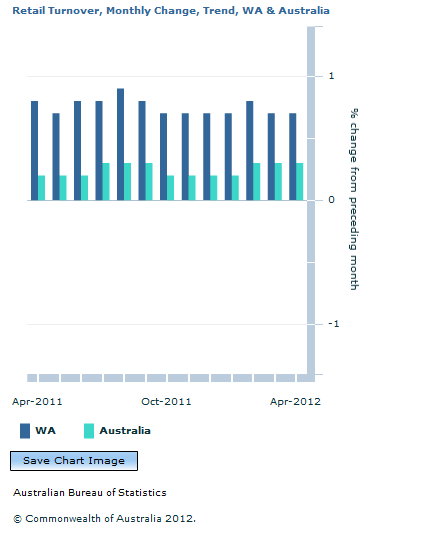
In April 2012, the trend estimate of retail turnover in WA increased by 0.7%, compared with a 0.3% increase nationally.
Percentage increases in WA's monthly retail turnover have been consistently higher, in trend terms, than national increases over the past 15 months.
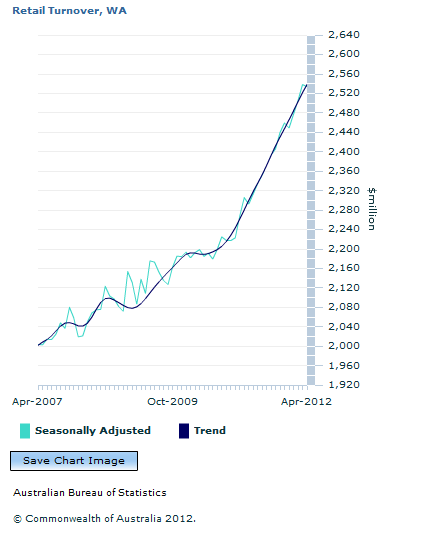
Estimated retail turnover in April 2012 was 9.5% higher, in trend terms, than in April 2011. This represents the highest annual increase, in trend terms, across all the States and Territories.
Estimates of the value of turnover of retail trade are compiled from the monthly Retail Business Survey, which collects sales data from a random sample of approximately 500 'large' businesses and 2,750 'smaller' businesses across Australia. The scope of the survey is all employing retail trade businesses selling predominantly to households. Industries included in the survey are defined according to the Australian and New Zealand Standard Industrial Classification (ANZSIC) 2006. For the purpose of retail trade statistics, these industries are classified into 6 broad industry groups and 15 subgroups. Retail trade statistics released at the broad industry level include Food retailing; Household goods retailing; Clothing, footwear and personal accessory retailing; Department stores; Other retailing; and Cafes, restaurants and takeaway food services.
Turnover in retail trade includes retail sales, wholesale sales and (from July 2000) the goods and services tax as well as certain other takings and commissions.
Document Selection
These documents will be presented in a new window.
 Print Page
 Print All