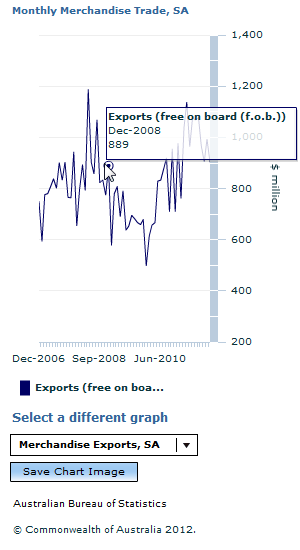
In November 2011, the value of SA goods exported overseas was $903 million, a decrease of 9.1% on the October 2011 value of $993 million.
At the same time, the value of goods imported into SA was $632 million, an increase of 1.4% on the October 2011 value of $623 million.
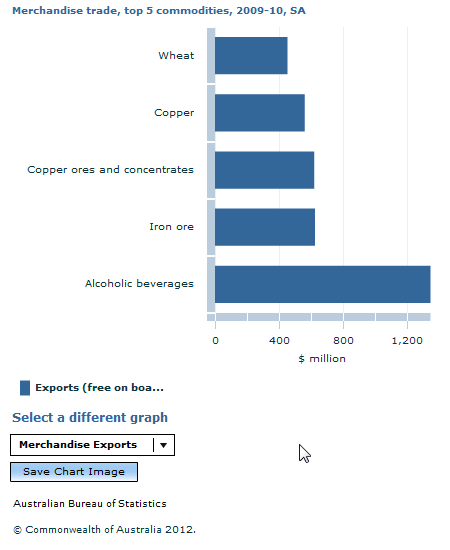
In 2009-10 the top five overseas exports from SA were Alcoholic beverages (SITC 112), Iron ore and concentrates (SITC 281), Copper ores and concentrates (SITC 283), Copper (SITC 682) and Wheat (SITC 041).
In 2009-10 the top five overseas imports into SA were Petroleum oils (excl. crude) (SITC 334), Motor cars (SITC 781), Motor vehicles for the transport of goods (SITC 782), Motor vehicle parts and accessories (SITC 784) and Rotating electric plant and parts (SITC 716).
Do you know how much your state or territory exports/imports?
International merchandise trade statistics are compiled by the Australian Bureau of Statistics from information submitted by exporters and importers or their agents to the Australian Customs Service (Customs). These statistics represent movements of commodities imported directly from or exported to overseas destinations. Interstate trade movements are not included. International trade statistics are used extensively to monitor Australia's export and import performance and they are a key input to Australia's balance of payments and national accounts statistics.
Document Selection
These documents will be presented in a new window.
 Print Page
 Print All