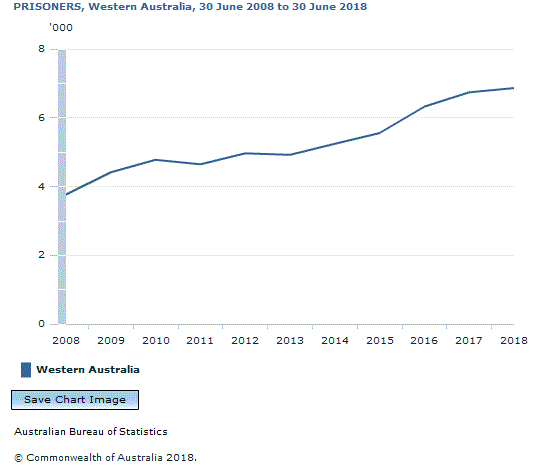
The number of adult prisoners in Western Australian prisons was 6,865, an increase of 2% (122 prisoners) from 2017. (Table 15)
The adult imprisonment rate was 344 prisoners per 100,000 adult population, an increase from 340 prisoners per 100,000 adult population in 2017. (Table 19)
Almost two-thirds of prisoners (62% or 4,222 prisoners) had previously been imprisoned under sentence. (Table 14)
The most common offences/charges were Acts intended to cause injury (19% or 1,309 prisoners), and Illicit drug offences (19% or 1,301 prisoners), followed by Unlawful entry with intent (15% or 1,048 prisoners). This is the only state or territory where prisoners sentenced or charged with Illicit drug offences has equalled the number for Acts intended to cause injury. (Table 16)
Sex
Males comprised 89% (6,124 prisoners) of the total prisoner population. This was the lowest proportion of male prisoners for all state and territories. (Table 14)
From 30 June 2017, the male imprisonment rate increased from 612 to 618 prisoners per 100,000 male adult population, while the female imprisonment rate increased from 69 to 74 prisoners per 100,000 female adult population. These were the highest rates in Western Australia over the past decade. (Table 15)
Age
The median age of adult prisoners was 35 years of age. (Table 14)
Country of Birth
Overseas-born prisoners accounted for 16% of the Western Australian adult prisoner population, with the largest proportion from New Zealand (21% of overseas born prisoners) followed by United Kingdom (18% of overseas born prisoners). (Table 22)
Aboriginal and Torres Strait Islander Prisoners
Aboriginal and Torres Strait Islanders comprised 39% (2,710 prisoners) of the adult prisoner population. (Table 14)
The Aboriginal and Torres Strait Islander age standardised imprisonment rate was more than 16 times more than the non-Indigenous age standardised imprisonment rate (3,717 prisoners per 100,000 Aboriginal and Torres Strait Islander adult population compared to 225 prisoners per 100,000 adult non-Indigenous population). (Table 18)
Legal Status
Unsentenced prisoners comprised 28% (1,908 prisoners) of the adult prisoner population. (Table 14)
The median time spent on remand by unsentenced prisoners was 3.4 months, which was higher than the national average of 3.2 months. (Table 32)
The median aggregate sentence length for sentenced prisoners was 2.6 years. (Table 26)
Document Selection
These documents will be presented in a new window.
 Quality Declaration
  Print Page
 Print All