Archived content. This page is no longer actively maintained and may not function as intended. For the latest information and statistics visit the ABS Website.
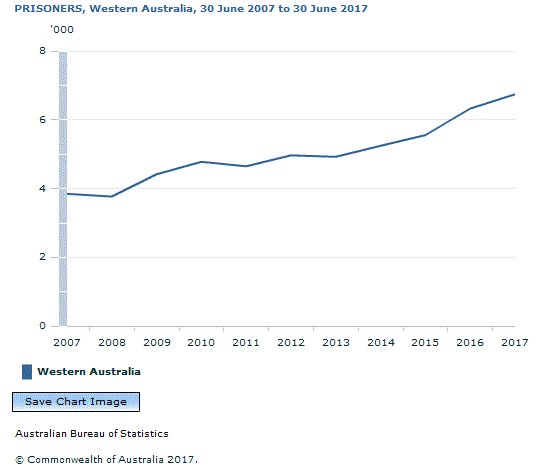
The number of adult prisoners in Western Australian prisons was 6,743, an increase of 7% (414 prisoners) from 2016. (Table 15)
The adult imprisonment rate was 340 prisoners per 100,000 adult population, an increase from 314 prisoners per 100,000 adult population in 2016. (Table 19)
Three in five prisoners (60% or 4,060 prisoners) had previously been imprisoned under sentence. (Table 14)
The most common offence/charge was Acts intended to cause injury (21% or 1,389 prisoners), followed by Illicit drug offences (19% or 1,271 prisoners) and Unlawful entry with intent (15% or 1,004 prisoners). (Table 16)
Sex
Males comprised 90% (6,059 prisoners) of the total prisoner population. (Table 14)
From 30 June 2016, the male imprisonment rate increased from 562 to 612 prisoners per 100,000 male adult population, while the female imprisonment rate increased from 63 to 69 prisoners per 100,000 female adult population. These were the highest rates in Western Australia over the past decade. (Table 15)
Age
The median age of adult prisoners was 34 years of age. (Table 14)
Country of Birth
Overseas-born prisoners accounted for 17% (1,146 prisoners) of the Western Australian adult prisoner population, with the largest proportion from New Zealand (233 prisoners) followed by United Kingdom (224 prisoners), each representing 20% of overseas born prisoners. (Table 22)
Aboriginal and Torres Strait Islander Prisoners
Aboriginal and Torres Strait Islanders comprised 37% (2,514 prisoners) of the adult prisoner population. (Table 14)
The Aboriginal and Torres Strait Islander age standardised imprisonment rate was 15 times more than the non-Indigenous age standardised imprisonment rate (3,495 prisoners per 100,000 Aboriginal and Torres Strait Islander adult population compared to 228 prisoners per 100,000 adult non-Indigenous population). (Table 18)
Legal Status
Unsentenced prisoners comprised 29% (1,926 prisoners) of the adult prisoner population. (Table 14)
The median time spent on remand by unsentenced prisoners was 3.6 months, which was higher than the national average of 3.3 months. (Table 32)
The median aggregate sentence length for sentenced prisoners was 2.5 years. (Table 26)
Document Selection
These documents will be presented in a new window.
 Quality Declaration
  Print Page
 Print All