4510.0 - Recorded Crime - Victims, Australia, 2017  Quality Declaration
Quality Declaration ARCHIVED ISSUE Released at 11:30 AM (CANBERRA TIME) 28/06/2018
Page tools:
 Print Page Print Page
 Print All Print All
| ||
NEW SOUTH WALES HOMICIDE AND RELATED OFFENCES The number of victims of Homicide and related offences in New South Wales decreased for the fourth consecutive year, down by 27%, from 98 victims in 2016 to 72 victims in 2017. (Table 6) The majority (74%) of Homicide victims were male (53 victims) and 47% of these male victims were aged between 35 and 54 years. Of the 19 female victims of Homicide recorded in 2017, nearly a third (32%) were aged between 35 and 54 years. (Table 7) Murder comprised 67% of all Homicides recorded in New South Wales during 2017 (48 victims) and the majority (65%) occurred at a residential location (31 victims). A knife was the most common weapon used by the offender(s) (20 victims). (Tables 6, 8 and 9) ASSAULT In 2017, there were 65,460 victims of Assault recorded in New South Wales, an increase of less than 1% on the previous year (up 200 victims). This equated to a decrease of 12 victims of Assault per 100,000 persons between 2016 and 2017 and represented an on-going decline in the rate of Assault in New South Wales since the time series began in 2010. (Table 6) , New South Wales.GIF) Footnote(s): (a) Rate per 100,000 persons for the state/territory of interest (see Explanatory Notes). Source(s): Recorded Crime – Victims Just under a quarter of Assault victims were aged between 25 and 34 years (24% or 15,929 victims), while a further 19% were aged between 35 and 44 years (12,490 victims). Males comprised just over half (54%) the total number of Assault victims recorded in New South Wales in 2017 (35,465 victims). (Table 7) More than half (53%) of all Assault victimisations occurred at a residential location (34,596 victims), while around 17% occurred on a street or footpath (11,072 victims). Two-thirds of victims (67%) knew the offender (43,575 victims). (Table 8 and 11) Of the six states and territories for which Assault data were available, New South Wales had the lowest proportion of weapon use (5% or 3,141 victims). Where a weapon was used in an assault, it was most commonly a knife (44% of assaults involving a weapon or 1,383 victims). (Table 9) SEXUAL ASSAULT The number of victims of Sexual assault recorded in New South Wales increased by 12%, from 8,795 victims in 2016 to 9,847 victims in 2017, to reach their highest levels over the eight year time series. (Table 6) Approximately one in five Sexual assault victims were male (19%), which was the second highest proportion of male victims across the states and territories (1,915 victims). The most common age for male victims of Sexual assault was between 0 and 9 years (24% or 452 victims). (Table 7) There were 7,926 female victims of Sexual assault in New South Wales in 2017, an increase of 13% (936 victims) from the previous year. More than a quarter of female victims were aged between 15 and 19 years (28% or 2,226 victims). (Tables 7 and 12) Over three-quarters of Sexual assault victims knew the offender (76% or 7,446 victims), with non-family member the most commonly recorded relationship type (4,620 victims). Non-family member includes a variety of relationships such as ex-partners, foster parents, teachers, acquaintances, colleagues, friends, etc. (Table 11) The majority (64%) of Sexual assaults occurred at a residential location (6,289 victims). Less than 1% involved the use of a weapon (38 victims). (Tables 8 and 9) ROBBERY After six consecutive decreases recorded between 2010 and 2016 (by 60%, from 6,569 to 2,602 victims), New South Wales Robbery victims increased in 2017, up 3% (or 74 victims) to 2,676 victims. (Table 6) In particular, victims of Unarmed robbery increased by 7% (108 victims), which was also the first increase in this offence since the beginning of the time series in 2010. (Table 8) 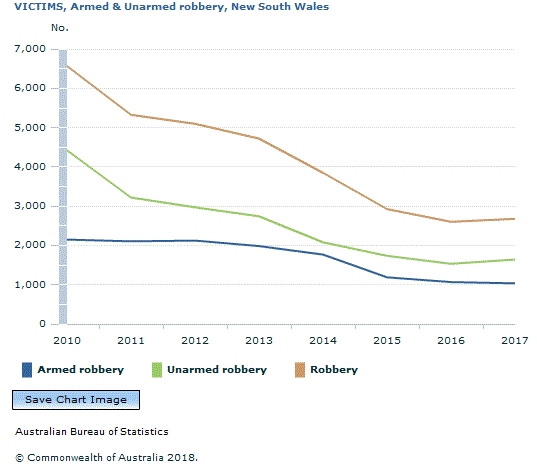 Source(s): Recorded Crime – Victims In nearly two-thirds of all Robberies (61%) the offender(s) was not armed (1,639 victims) and the most common location for these to occur was on a street/footpath (47% or 763 victims). (Table 8) Armed robbery decreased by 3% during 2017 (down 33 victims to 1,035 victims). A knife was the most common weapon (689 victims) used in Armed robberies and most commonly occurred in a retail location (39% or 398 victims). (Tables 8 and 9) PROPERTY CRIME In 2017, there were 12,377 victims of Motor vehicle theft recorded in New South Wales, up 3% from 12,013 victims in 2016. This was the first increase in the number of victims of this offence in New South Wales since the beginning of the time series in 2010. (Table 6) An outbuilding or residential land (including a driveway, carport or garage) was the most common location from which a motor vehicle was taken (48% or 5,913 victims). (Table 8) Between 2016 and 2017, the number of victims of Unlawful entry with intent decreased by 7%. This represented the seventh consecutive annual decrease since the series began in 2010, with the overall number of victims decreasing by over a third (36% or 21,498 victims) over this longer reference period. (Table 6) Three-quarters (75%) of break- ins occurred at a residential location (28,660 victims). (Table 8) There were 132,202 victims of Other theft recorded in New South Wales, decreasing by 3% since 2016. Victims of Other theft in New South Wales accounted for just over a quarter (26%) of the total Other theft victims in Australia. More than a third (36%) of victimisation of Other theft in New South Wales took place in a retail location. (Tables 1 and 6) Document Selection These documents will be presented in a new window.
|
||
