Australian Health Survey: Nutrition First Results - Foods and Nutrients

Latest release

Provides a snapshot of food and nutrient consumption. Analysis and datacubes include average consumption and proportion derived from each food group

Reference period
2011-12 financial year
Released
9/05/2014
Next release Unknown
First release

Key findings

Food consumption

In 2011-12, Australians aged 2 years and over consumed an estimated 3.1 kilograms of foods and beverages (including water) per day, made up from a wide variety of foods across the major food groups.

  • On the day before interview, almost all people (97%) reported consuming foods from the Cereals and cereal products or Cereal-based products and dishes groups. Regular bread and bread rolls was the most commonly eaten type of Cereal and cereal product, being consumed by 66% of people. Ready to eat breakfast cereals were eaten by 36% of the population.
  • More than eight out of ten people (85%) consumed from the Milk products and dishes group on the day prior to interview, with foods in this group providing an average 11% of the population's energy intake. Around two-thirds (68%) of people consumed Dairy milk, while almost one-third (32%) had Cheese.
  • Meat, poultry and game products and dishes were consumed by around seven out of ten (69%) people on the day prior to interview, providing 14% of total energy intakes. Chicken was the most commonly consumed meat within this category with 31% either eating a piece of chicken or eating chicken as part of mixed dish. Beef was consumed by 20% (either alone or in a mixed dish). Ham was the most commonly consumed processed meat, being consumed by 12% of the population.
  • Vegetable products and dishes were consumed by three-quarters (75%) of the population, with Potatoes making up around one-quarter (by weight) of all vegetables consumed. Based on people's self-reported usual consumption of vegetables, just 6.8% of the population met the recommended usual intake of vegetables.
  • Fruit products and dishes were consumed by six out of ten people (60%) overall on the day before interview. Based on self-reported usual serves of fruit eaten per day, just over half (54%) met the recommendations for usual serves of fruit.
  • The most popular beverages consumed were water (consumed by 87% of the population), coffee (46%), tea (38%) soft drinks and flavoured mineral waters (29%) and Alcoholic beverages (25%).
  • Just over one-third (35%) of total energy consumed was from 'discretionary foods', that is foods considered to be of little nutritional value and which tend to be high in saturated fats, sugars, salt and/or alcohol. The proportion of energy from discretionary foods was highest among the 14-18 year olds (41%). The particular food groups contributing most of the energy from discretionary foods were: Alcoholic beverages (4.8% of energy), Cakes, muffins scones and cake-type desserts (3.4%), Confectionery and cereal/nut/fruit/seed bars (2.8%), Pastries (2.6%), Sweet biscuits and Savoury biscuits (2.5%) and Soft drinks and flavoured mineral waters (1.9%).
     

Energy and nutrients

The average energy intake was 9,655 kilojoules (kJ) for males and 7,402 kJ for females. Energy intakes were lowest among the toddler aged children who averaged 5,951 kJ and were highest among 19-30 year old males (11,004 kJ). Female energy intakes were highest among the 14-18 year olds (8,114 kJ).

  • Carbohydrate contributed the largest proportion of total energy, supplying 45% on average with the balance of energy coming from fat (31%), protein (18%), alcohol (3.4%) and dietary fibre (2.2%).
  • Within carbohydrates, starch contributed 24% and sugars contributed 20% of energy. The major source of total sugars (natural and added) in the diets were: Fruit (providing 16% of sugars), Soft drinks and flavoured mineral waters (9.7%), Dairy milk (8.1%), Fruit and vegetable juices and drinks (7.5%), Sugar, honey and syrups (6.5%), Cakes, muffins, scones, cake-type desserts (5.8%).
  • The average daily intake of sodium from food was just over 2,404 mg (equivalent to around one teaspoon of table salt). This amount includes sodium naturally present in foods as well as sodium added during processing, but excludes the 'discretionary salt' added by consumers in home prepared foods or 'at the table'. In addition to sodium from food, 64% of Australians reported that they add salt very often or occasionally either during meal preparation or at the table, therefore the true average intake is likely to be significantly higher.
     

Dietary supplements

In 2011-12, 29% of Australians reported taking at least one dietary supplement on the day prior to interview. Females were more likely than males to have had a dietary supplement (33% and 24% respectively), with the highest proportion of consumers in the older age groups. Multivitamin and/or multimineral supplements were the most commonly taken dietary supplements, being consumed by around 16% of the population with Fish oil supplements taken by around 12% of the population.

Dieting

In 2011-12, over 2.3 million Australians (13%) aged 15 years and over reported that they were on a diet to lose weight or for some other health reason. This included 15% of females and 11% of males. Being on a diet was most prevalent among 51-70 year olds where 19% of females and 15% of males were on some kind of diet.

Food avoidance

In 2011-12, 17% of Australians aged 2 years or over (or 3.7 million people) reported avoiding a food type due to allergy or intolerance and 7% (1.6 million) avoided particular foods for cultural, religious or ethical reasons.

  • The most common type of food intolerance reported was Cow's milk/Dairy (4.5%), followed by Gluten (2.5%), Shellfish (2.0%) and Peanuts (1.4%).
  • Pork was the most commonly avoided food type (3.9%) for cultural, religious or ethical reasons, while 2.1% specified avoiding all meat.


See Appendix 1 for an overview of the major food groups and the Glossary for other definitions.
Foods consumed

Food groups

Food and beverages reported by respondents in the National Nutrition and Physical Activity Survey (NNPAS) were collected and coded at a detailed level, but for output purposes are categorised within a food classification with major, sub-major, and minor group levels. At the broadest level (the Major group) there are 24 groups. These groups were designed to categorise foods that share a major component or common feature. Because many foods are in fact mixtures of different ingredients, the food groups will not exclusively contain the main food of that group. For example, a beef and vegetable casserole will belong within the major group of Meat, poultry and game products and dishes, yet will contain vegetables and sauce or gravy.

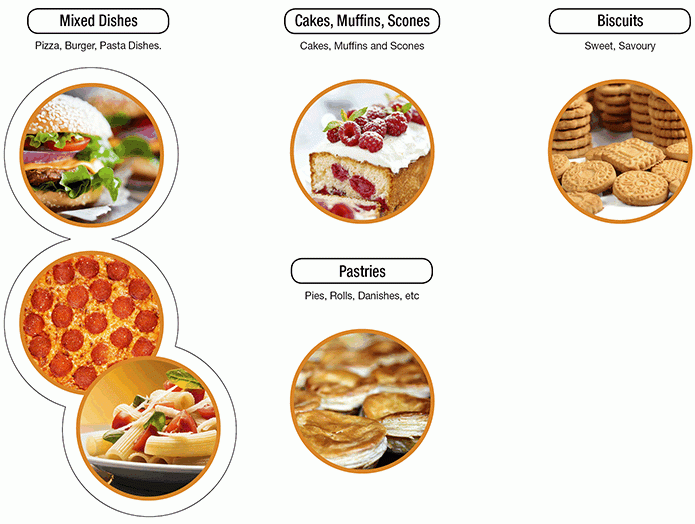
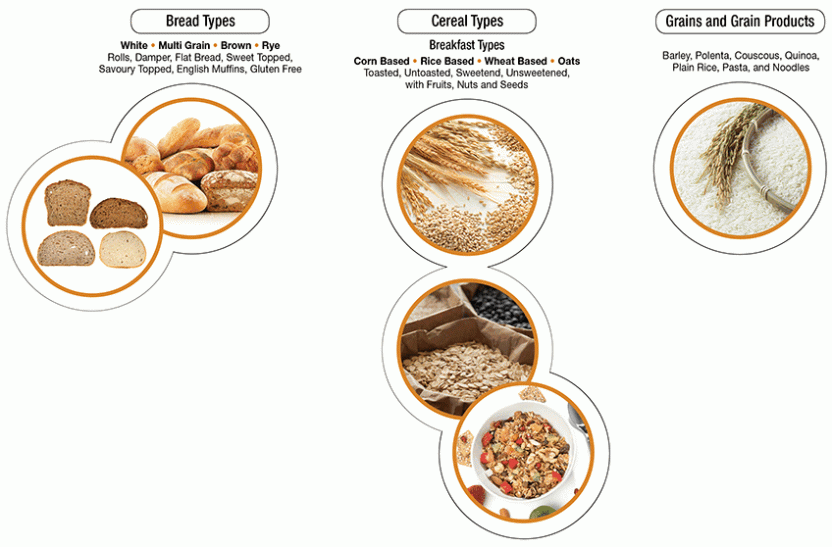
Cereal-based products and dishes is a particular example of a Major group where there may be a significant proportion of other (non-cereal) ingredients in the foods. While the common feature of this food group is cereal, the foods belonging to this group are very diverse and includes biscuits, cakes, pastries, mixed pasta or rice dishes, burgers, pizza and tacos. The Cereal-based products and dishes should not be confused with Cereal and cereal products which contains more basic foods such as bread, plain rice, plain pasta, breakfast cereals, oats and other grains.

For more information see Appendix 1: Example foods in Major food groups and the Nutrition section of the AHS Users' Guide.

In 2011-12, Australians aged 2 years and over consumed an estimated average of 3.1 kilograms of foods and beverages per day, made up from a wide variety of foods across the major food groups. In the day before interview, a majority of respondents in the AHS reported consuming Cereals and cereal products (90%), Milk products and dishes (85%), Vegetable products and dishes (75%), Cereal-based products and dishes (72%), Meat, poultry and game products and dishes (69%) and Fruit products and dishes (60%). In addition, 87% of people reported drinking plain water (including municipal and bottled water) see Table 4.1.

  1. Most commonly consumed major food groups on the day prior to interview. See Appendix 1 for examples of foods in major food groups.


Statistics presented in this publication on foods consumed include:

  • the proportion of a population consuming food from a food group
  • the average (mean) amount consumed by a population (including non consumers)
  • the median amount consumed by a population (which excludes non consumers).
     

Non-alcoholic beverages

Cereals and cereal products

Milk products and dishes

Vegetable products and dishes

Cereal based products and dishes

Meat, poultry and game products and dishes

Fruit products and dishes

Sugar products and dishes

Fats and oils

Confectionery and cereal, nut, fruit, seed bars

Alcoholic beverages

Energy and nutrients

Energy and nutrient intakes in this publication are derived only from foods and beverages from the first 24-hour recall day. The nutrients from supplements are excluded from this analysis. No adjustment has been made to include information from the second 24-hour recall day to calculate usual intakes, which will be the focus of the Australian Health Survey: Usual Nutrient Intakes publication (scheduled for release in late 2014).

Energy

Dietary energy is required by the body for metabolic processes, physiological functions, muscular activity, heat production and growth and development.¹ Energy requirements vary with age, sex, body size and physical activity, so the amount of energy consumed would be expected to vary considerably throughout the population. On the day prior to interview, the average energy intake was 9,655 kilojoules (kJ) for males and 7,402 kJ for females see Table 1.1. However, this is likely to be an under-estimate due to the inherent under-reporting bias associated with dietary surveys. It is difficult, from the available data, to accurately estimate the amount of under-reporting that has occurred and therefore how much energy and nutrients might be missing from the intakes reported by respondents. One method is to estimate the mean amount of energy required for each individual to achieve an EI:BMR ratio of 1.55 (i.e. the conservative minimum energy requirement for a normally active but sedentary population). Using this method, it is estimated that the average energy intakes may be understated by as much as 17% in males and 21% in females. The factor most closely associated with under-reporting was BMI, where people who were overweight or obese were most likely to have lower than expected energy intakes. For more information see Under-reporting in Nutrition Surveys in the AHS Users' Guide.

Energy intakes were lowest among the toddler aged children who averaged 5,951 kJ and were highest among 19-30 year old males (11,004 kJ). Female energy intakes were highest among the 14-18 year olds (8,114 kJ).

  1. On the day prior to interview.


The leading sub-major food groups contributing energy were Mixed dishes where cereal is the major ingredient (9.9%), Regular breads, and bread rolls (7.7%), Beef, sheep and pork (including mixed dishes) (5.7%), Poultry (including in mixed dishes) (5.4%), Dairy milk (4.3%), Breakfast cereals ready to eat (3.7%) and Cakes, muffins, scones, cake-type desserts (3.5%) see Table 8.1.

Endnotes

Macronutrients

Dietary energy is derived from the macronutrient content of foods. The energy yielding macronutrients are: protein, fat, carbohydrate and alcohol with small amounts of additional energy provided by dietary fibre and organic acids. Imbalances in the proportion of energy derived from macronutrients are associated with increased risk of chronic diseases. There is however, a wide range in which the macronutrient balance is considered acceptable for managing chronic disease risk. Reference ranges known as Acceptable Macronutrient Distribution Ranges (AMDR) form part of the recommendations for optimising diets to lower chronic disease risk while ensuring adequate micronutrient status.¹

  1. Proportions will not add to 100% due to excluding energy from fibre and other components. See User Guide - Energy conversion factors


Overall, the average proportion of energy from protein, fat, and carbohydrate of the population (based on a single 24-hour recall) was within the bounds of the AMDR. Carbohydrate contributed the largest proportion to the population's energy intake with 45%, a level similar to that in 1995, but still at the lower end of the recommended intake range (45% to 65%). Based on a single day's intake it is not possible to estimate the proportion who would have usual intakes that were below the AMDR². However, some age groups (31-50 years, 51-70 years and 71 years and over) had averages that were below the lower end of the range indicating that a considerable proportion may have a carbohydrate contribution of less than 45% of energy. The lowest was 42% among the 51-70 year olds. While this population was within the AMDR for protein and fat, their proportion of energy from alcohol (5.6%) was high relative to other age groups see Table 2.1.

The balance of macronutrients shifted across age groups, with children tending to have a greater proportion of energy coming from carbohydrate and less from protein than progressively older age groups. Between the age of 4-8 years and 51-70 years, the carbohydrate contribution to energy declined from 51% to 42%, while protein increased from 16% to 19% see Table 2.1. The dietary patterns responsible for this shift are seen in the different proportion of food types contributing to energy intake. For example, the children aged 4-8 years had a higher proportion of their energy coming from the carbohydrate-rich Regular bread, and bread rolls (9.8%) and Mixed dishes where cereal is the major ingredient (8.6%) than the 51-70 year olds (8.5% and 6.4% respectively). In contrast, the 4-8 year olds had a lower proportion of energy coming from Beef, sheep and pork (including mixed dishes) at 2.6% compared with 7.2% among the 51-70 year olds see Table 8.1

Endnotes

  1. National Health and Medical Research Council 2006, Nutrient Reference Values for Australia and New Zealand, Canberra: National Health and Medical Research Council http://www.nrv.gov.au/chronic-disease/macronutrient-balance, Last accessed 02/05/2014.
  2. Please refer to Glossary for definitions.
     

Carbohydrate

Protein

Fat

Alcohol

Selected micronutrients

The vitamins and minerals presented in Table 1.1 and Table 3.1 are based on Day 1 intakes from foods only, (that is, not adjusted for usual intakes and exclusive of any amounts taken from dietary supplements). Although the data are presented alongside Nutrient Reference Values (NRVs) such as Estimated Average Requirements, (EARs), these are for context only and do not indicate the levels of nutrient deficiency/excess intake of the population group in relation to that NRV.

In order to make assessments about the proportion of the population who are at risk of inadequate intakes over the longer term, it is necessary to consider not only the mean or median intake but also the distribution of longer-term ‘usual’ intake in the population. Such an analysis requires estimates of usual intake distributions (i.e. percentiles) to be compared with NRVs and will be the focus of a future AHS product release. For more information about estimating usual intakes see the AHS Users' Guide - Usual Nutrient Intakes.

Folate

Vitamin B12

Calcium

Sodium

Iodine

Iron

Thiamin

Supplements

Dietary supplements

Dietary supplements include vitamins, minerals, oils, herbs and other nutritive and non-nutritive supplements. These are also referred to as 'complementary medicines,' and the many thousands of these various products are regulated within Australia by the Therapeutic Goods Administration.

In 2011-12, 29% of Australians reported taking at least one dietary supplement on the day prior to interview. Females were more likely than males to have had a dietary supplement (33% and 24% respectively), with the highest proportion of consumers in the older age groups. Almost half (49%) of women aged 71 years and over had taken a supplement, as had 44% of the 51-70 year old women see Table 11.1.

Half (50%) of the people who had taken a supplement had only taken one type of supplement, with around one-quarter (26%) taking two different supplements and another quarter (24%) taking three or more different supplements.

  1. On the day prior to interview.
     

Multi-vitamin and/or multi-mineral supplements were the most commonly taken dietary supplements, being consumed by around 16% of the population with Fish oil supplements taken by around 12% of the population see Table 11.1.

Some single vitamin or mineral supplements while taken by relatively low proportions of the population, had particularly high proportion of consumers in some groups. For example, Calcium and Vitamin D were taken by between 3% and 4% of the population overall, but by around 13-14% of women aged 71 years and over see Table 11.1.

Protein supplements

Special dietary foods is a food category within the food classification used in the 2011-12 NNPAS, but includes foods such as protein supplements. By weight, 70% of the Special dietary foods consumed were Sport and protein prepared beverages and a further 5% were Sport and protein dry powders see Table 5.3. Overall, 2.9% of the population had consumed Special dietary foods on the day prior to interview, but the rate among young men was considerably higher with 7.8% of the 19-30 year olds consuming a Special dietary food see Table 4.1

Dieting

Health and body image are among a range of factors that can influence what and how people eat. Dieting may be one response to these particular concerns. In 2011-12, over 2.3 million Australians (13%) aged 15 years and over reported that they were on a diet to lose weight or for some other health reason. This included 15% of females and 11% of males. Being on a diet was most prevalent among 51-70 year olds where 19% of females and 15% of males were on some kind of diet see Table 13.1.


Around two-thirds of people who reported being on a diet (or 8.9% of the population aged 15 years and over), indicated they were on a diet to lose weight (including for health reasons as well as to lose weight), while 4.2% of the population were on a diet for other health reasons alone see Table 13.1.

Around half (49%) of people on a diet described the type of diet they were on as Weight loss or low calorie, with a higher proportion of female dieters being on a Weight loss or low calorie diet than men (53% and 44% respectively). The type of diet also varied by age group, with people aged 71 years and over most likely to report being on a Diabetic diet (31%) or Low fat / cholesterol diet (30%). In contrast, younger people aged 15-30 years were more likely to be on a Weight loss or low calorie diet (55%) or High protein diet (21%) see Table 13.1.

  1. People may report more than one type of diet.
     

Dieting and body mass

Food avoidance due to allergy, intolerance or ethical/ religious reasons

While for many people, avoiding particular foods is about taste, preference or an effort to make healthy choices, for a significant minority of the population, it is not simply a matter of choice. In 2011-12, 17% of Australians aged 2 years or over (or 3.7 million people) reported avoiding a food due to allergy or intolerance and 7% (1.6 million) avoided particular foods for cultural, religious or ethical reasons see Table 14.1.


Food avoidance due to allergy or intolerance was most prevalent among males aged 31-50 years (17%) and females aged 51-70 years (25%). The most common type of food reported causing intolerance was Cow's milk/Dairy (4.5%), followed by Gluten (2.5%), Shellfish (2.0%) and Peanuts (1.4%). While these were the most prevalent types of specific foods that were avoided, a higher proportion of people (8.5%) reported an 'Other' food that was not specifically prompted for. 'Other' included a large variety of specific foods (such as tomatoes, oranges, bananas, and capsicum) and general food types (such as 'spicy food', 'preservatives' and 'acidic foods').

  1. People may report more than one type of avoidance.
     

Food avoidance for cultural, religious or ethical reasons was highest among the 19-30 year olds (10%) and the 31-50 years group (9.0%). Pork was the most commonly avoided food (3.9%), followed by Meat (2.1%), while 1.6% specified avoiding Beef.

Discretionary foods

The related risk factors of diet and overweight and obesity contribute a high proportion of disease burden in Australia, manifesting particularly in cardiovascular disease, Type 2 diabetes and certain cancers.¹ In 2011-12, 63% of adults and 25% of children in Australia were overweight or obese, with these rates having risen in recent decades.² In addition to regular physical activity, following eating patterns which can provide adequate nutrient intakes whilst not exceeding energy requirements are seen as key to achieving and maintaining healthy body weight. In order to meet nutrient requirements within limited energy intakes, it is suggested that consumption of discretionary (energy dense, nutrient poor) food be reduced.³

Discretionary foods in the NNPAS


The Australian Dietary Guidelines³ states discretionary foods are: “foods and drinks not necessary to provide the nutrients the body needs, but that may add variety. However, many of these are high in saturated fats, sugars, salt and/or alcohol, and are therefore described as energy dense. They can be included sometimes in small amounts by those who are physically active, but are not a necessary part of the diet.”

On average, just over one-third (35%) of total daily energy reported as consumed was from 'discretionary foods'. The proportion of energy from discretionary foods was lowest among the 2-3 year old children (30%) and highest among the 14-18 year olds (41%). The proportion of energy from discretionary foods tended to decrease in age groups from 19-30 years and older, however females had significantly lower proportions of consumption than males from 31-50 years to 71 years and over see Table 9.1.

The particular food groups contributing most to the energy from discretionary foods reported were: Alcoholic beverages (4.8% of energy), Cakes, muffins scones and cake-type desserts (3.4%), Confectionery and cereal/nut/fruit/seed bars (2.8%), Pastries (2.6%), Sweet biscuits and Savoury biscuits (2.5%) and Soft drinks and flavoured mineral waters (1.9%). These were followed by smaller proportions of energy from a range of other discretionary foods including Potatoes (as chips/fries etc) (1.7%), Snack foods (1.5%), Frozen milk products (1.5%) and Sugar, honey and syrups (1.3%).

The proportion of energy contributed by particular discretionary foods varied with age. For example, the largest discretionary food contributor to the 2-3 year olds energy was Biscuits (4.8%), while for 4-8 and 9-13 year olds it was Cakes, muffins, scones and cake-type desserts (4.8% and 4.6% respectively). Among the 14-18 year olds it was Confectionery and cereal/nut/fruit/seed bars and Soft drinks and flavoured mineral waters (3.7% and 3.6% respectively). In all older age groups, alcoholic drinks formed the largest source of energy from discretionary foods, with 6.0% of energy consumed by people aged 19 years and over coming from Alcoholic beverages see Table 9.1.

Endnotes

Consumption of sweetened beverages

Introduction

Health problems that are linked to poor eating patterns such as heart disease, type 2 diabetes and some cancers, place an enormous burden on individuals, families and society as a whole¹. Recent public health interest has focused on the associations between consumption of added sugars and adverse health outcomes. Sweetened beverages are a major source of added sugar in the diet and are seen as a target for public health intervention, as their consumption is associated with higher energy consumption, weight gain and increased risk of health problems such as dental caries, high blood pressure, type 2 diabetes and cardiovascular disease²⁻⁹.

In the Australian Dietary Guidelines, the National Health and Medical Research Council (NHMRC) recommends limiting the intake of sugar-sweetened soft drinks and cordials, fruit drinks, vitamin waters, energy and sports drinks³. In 2006, Australia was one of the 10 highest soft drink consuming countries, based on per capita consumption¹⁰. 

What are sweetened beverages?

There are a range of different definitions for Sweetened beverages both nationally and internationally. For the purpose of this article, Sweetened beverages include the sub-categories: sugar-sweetened beverages, and intense-sweetened beverages.

  • Sugar-sweetened beverages include cordials, soft drinks and flavoured mineral waters, energy and electrolyte drinks, fortified waters, and fruit and vegetable drinks* that contain added sugar (typically sucrose).
  • Intense-sweetened beverages include cordials, soft drinks and flavoured mineral waters, and energy and electrolyte drinks that have been artificially sweetened.


* Fruit and vegetable drinks are water-based beverages that contain some fruit and vegetable juice in addition to added sugar and preservatives¹¹.

Who consumed sweetened beverages?

In 2011-12, just under half (42%), or 9 million Australians aged 2 years and over, consumed Sweetened beverages on the day prior to interview; one-third of people (34%) consumed sugar-sweetened beverages and 10% consumed intense-sweetened beverages.

Overall, males were more likely to drink Sweetened beverages than females (46% compared with 38%). Specifically, males were more likely to drink sugar-sweetened beverages than females (39% compared with 29%), while the proportion consuming intense-sweetened beverages was similar for males and females.

Consumption of Sweetened beverages increased with age across childhood, peaking among teenagers aged 14-18 years, with 61% consuming Sweetened beverages on the day prior to interview. Two in three teenage males (67%) aged 14-18 years consumed Sweetened beverages, compared with one in two teenage females (55%). The proportion of the population consuming Sweetened beverages declined in successive older adult age groups to less than a quarter (23%) for those aged 71 years and over.

The proportion of people consuming sugar-sweetened beverages was higher for children aged 2-18 years (47%) than adults (31%).

Consumption of intense-sweetened beverages was higher among adults (11%) than children (6%) and consumers of intense-sweetened beverages tended to make up a relatively larger proportion of the consumers of Sweetened beverages among adults.

  1. On the day prior to interview.
     

Socioeconomic characteristics

Types of sweetened beverages consumed

  • The most commonly consumed Sweetened beverages on the day prior to interview were soft drinks and flavoured mineral waters (29%), with males having consumed more than females (33% compared with 26%).
  • One in ten people (10%) consumed fruit and vegetable drinks, with consumption highest among children (17%).
  • Around 7% of people consumed cordial, with children the most common consumers (11%).
  • Around 3% of people consumed electrolyte and energy drinks, and fortified waters.  Teenagers and young adults aged 14-30 years were the highest consumers (6%).
     

How much did people consume?

Of those who consumed Sweetened beverages on the day prior to interview, the median amount consumed was the equivalent of a regular can (375 mls), with males consuming more than females (450 mls compared with 375 mls).

The median amount of Sweetened beverages consumed generally increased with age across childhood, peaking at 519 mls for those aged 19-30 years, and decreasing over successive age groups.

Among Sweetened beverage consumers, the amount consumed varies widely. While the median amount of Sweetened beverages consumed on the day prior to interview was around the size of a regular can, the top ten per cent highest consumers of Sweetened beverages consumed more than 1L on the day prior to interview, peaking at 1.5L for males aged 19-30 years. Further analysis of the variation in amount of Sweetened beverages consumed will be published in March 2016.

Types of sweetened beverages consumed

  • Of the 29% of people who consumed soft drinks and flavoured mineral waters, the median daily intake was equivalent to one regular can (375 mls).
  • The median daily intake of fruit and vegetable drinks by those who consumed them was just over one standard glass (290 mls).
     

Changes since 1995

Consumption trends

Under-reporting

Energy and nutrients intake from sweetened beverages

Energy

Sweetened beverages contributed 4% of the total energy intake for people aged 2 years and over, with the proportion for males being slightly higher than for females. Teenagers aged 14-18 years consumed 6% of their energy from Sweetened beverages.

Total sugars

Sugar-sweetened beverages contributed 17% of the total sugars (natural and added) consumed overall, with more for males than females (20% compared with 14%). Soft drinks and flavoured mineral waters contributed the greatest amount to total sugars (10%), followed by fruit and vegetable drinks (4%), cordials (3%), and energy and electrolyte drinks and fortified waters (1%).

Males aged 14-18 years consumed almost one-third (31%) of their total sugars from sugar-sweetened beverages, with soft drinks and flavoured mineral waters the biggest contributor (21%). For females aged 19-30 years, Sweetened beverages contributed around one-fifth (21%) of their total sugar intake, with the majority from soft drinks and flavoured mineral waters (12%).

  1. On the day prior to interview.
     

Of people who consumed sugar-sweetened beverages, the average amount of sugar consumed was equivalent to 13 teaspoons (54 g), with males having consumed more than females (14 teaspoons or 60 g compared with 11 teaspoons or 45 g)¹³. On average, teenagers aged 14-18 years consumed 14 teaspoons (58 g) of sugar from sugar-sweetened beverages with males in this age group having consumed more than females (16 teaspoons or 68 g compared with 11 teaspoons or 45 g).

Health risk factors associated with consumption of sweetened beverages

Overweight and obesity

While cross-sectional surveys such as the 2011-12 NNPAS cannot be used to identify causal relationships between health outcomes and behaviours or risk factors, the associations at a point in time provide an indication of current behaviours which can impact on progress of the risk factor or disease. Of the approximately 10 million Australians who were overweight or obese¹, almost half 47% consumed Sweetened beverages, compared with 37% of those who were underweight or of a normal weight.

While females who were overweight or obese were more likely to drink sugar-sweetened beverages than those who were underweight or normal weight (34% compared with 27%), consumption for males was similar regardless of their body mass (around 40%). Consumption of intense-sweetened beverages among people who were overweight or obese (13%) was twice as high as for those who were underweight or normal weight (6%).

Aboriginal and Torres Strait Islander people

Results from the National Aboriginal and Torres Strait Islander Nutrition and Physical Activity Survey (NATSINPAS) showed that in 2012-13, more than half (56%) of Aboriginal and Torres Strait Islander people aged 2 years and over consumed Sweetened beverages on the day prior to interview, which was higher than for non-Indigenous people (42%). Half (50%) of Aboriginal and Torres Strait Islander people consumed sugar-sweetened beverages, compared with one-third of non-Indigenous people (34%). However, the proportion of people consuming intense-sweetened beverages was lower among Aboriginal and Torres Strait Islander people (7%) than non-Indigenous people (10%).

For Aboriginal and Torres Strait Islander people, consumption of Sweetened beverages increased with age across childhood, peaking at 65% for those aged 14-30 years, declining in the older age groups to 35% of the population aged 51 years and over.

  1. On the day prior to interview.
     

Of those who consumed Sweetened beverages on the day prior to interview, the median daily amount consumed was greater for Aboriginal and Torres Strait Islander people (455 mls) than for non-Indigenous people (375 mls).

Types of sweetened beverages consumed

Looking ahead

This analysis indicates that while two out of every five Australians consumed Sweetened beverages on any given day, there has been a decline in consumption over the past two decades. However, Sweetened beverages remain a prevalent feature in the diets of many Australians, particularly for males, people from socioeconomically disadvantaged backgrounds and Aboriginal and Torres Strait Islander people.

Further information on Australian's consumption of added sugar will be published in March 2016. This publication will present information on the usual intake of added sugars, including how much is consumed and from which food sources.

Data sources and interpretation of results

Endnotes

Under-reporting

Show all

Data downloads

Table 1: Mean daily energy and nutrient intake

Table 2: Mean contribution to energy intake: protein, fat, carbohydrate, dietary fibre and alcohol

Table 3: Nutrient density: mean nutrient intake per 1,000 kJ

Table 4: Proportion of persons consuming foods

Table 5: Mean daily food intake

Table 6: Median amount of foods consumed

Table 7: Mean daily energy from food groups

Table 8: Proportion of energy from food groups

Table 9: Proportion of energy from discretionary foods

Table 10: Proportion of nutrients from food groups

Table 11: Supplement consumption

Table 12: How often salt is used in household for cooking or preparing food then how often salt is added to food at the table and whether salt used is iodised

Table 13: Whether currently on a diet and type of diet

Table 14: Food avoidance due to allergies or intolerances then type of food avoidance for cultural, religious or ethical reasons

1995 Table 15: Mean daily energy and nutrient intake

1995 Table 16: Mean contribution to energy intake: protein, fat, carbohydrate, fibre and alcohol

1995 Table 17: Nutrient density: mean nutrient intake per 1,000 kJ

Table of contents

Table 18: Consumption of sweetened beverages

All data cubes

History of changes

Show all

About the National Nutrition and Physical Activity Survey

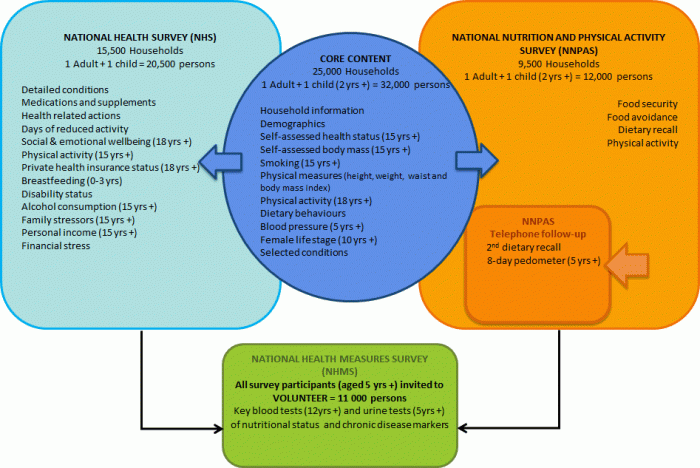
This publication is one of several ABS releases of results from the 2011-13 Australian Health Survey (AHS). The AHS is the largest, most comprehensive health survey ever conducted in Australia. It combines the existing ABS National Health Survey (NHS) and the National Aboriginal and Torres Strait Islander Health Survey together with two new elements - a National Nutrition and Physical Activity Survey (NNPAS) and a National Health Measures Survey (NHMS).

This publication is the first release of nutrition data from the 2011-12 National Nutrition and Physical Activity Survey (NNPAS). It presents results from a 24-hour dietary recall of food, beverages and dietary supplements, as well as some general information on dietary behaviours. Future releases will focus on usual intakes of nutrients including comparisons against nutrient reference values where relevant.

The 2011–13 Australian Health Survey (AHS) is the largest and most comprehensive health survey ever conducted in Australia. The survey, conducted throughout Australia, collected a range of information about health related issues, including health status, risk factors, health service usage and medications. In 2011–13, the AHS incorporated the National Nutrition and Physical Activity Survey (NNPAS). It involved the collection of detailed physical activity information using self-reported and pedometer collection methods, along with detailed information on dietary intake and foods consumed from over 12,000 participants across Australia. The nutrition component is the first national nutrition survey of adults and children (aged 2 years and over) conducted in over 15 years.

The AHS sample included Aboriginal and Torres Strait Islander people where they were randomly selected in the general population. The AHS also included an additional representative sample of Aboriginal and Torres Strait Islander people. The National Aboriginal and Torres Strait Islander Nutrition and Physical Activity Survey (NATSINPAS) will provide nutrition and physical activity results for Aboriginal and Torres Strait Islander people at the population level and provides an opportunity to compare results with the non-Indigenous population. Results for the NATSINPAS will be released in the first half of 2015.

Information for the nutrition component of the NNPAS was gathered using a 24-hour dietary recall on all foods and beverages consumed on the day prior to the interview. Where possible, at least 8 days after the first interview, respondents were contacted to participate in a second 24-hour dietary recall via telephone interview. This publication is the first release of information from the nutrition component of the NNPAS. It presents results from the first interview, with information on food, beverages and dietary supplements, as well as some general information on dietary behaviours.

The NNPAS has been made possible by additional funding from the Australian Government Department of Health and Ageing as well as the National Heart Foundation of Australia, and the contributions of these two organisations to improving health information in Australia through quality statistics are greatly valued.

The 2011–13 AHS, and particularly the NNPAS component, was developed with the assistance of several advisory groups and expert panels. Members of these groups were drawn from Commonwealth and state/territory government agencies, non-government organisations, relevant academic institutions and clinicians. The valuable contributions made by members of these groups are greatly appreciated.

Food Standards Australia New Zealand (FSANZ ) was contracted to provide advice throughout the survey development, processing and collection phases of the 2011-12 NNPAS and to provide a nutrient database for the coding of foods and supplements consumed. The ABS would like to acknowledge and thank FSANZ for providing their support, advice and expertise to the 2011-12 NNPAS.

The ABS gratefully acknowledges and thanks the Agricultural Research Service of the USDA for giving permission to adapt and use their Dietary Intake Data System including the AMPM for collecting dietary intake information as well as other processing systems and associated materials.

Finally, the success of the 2011–13 AHS was dependent on the very high level of cooperation received from the Australian public. Their continued cooperation is very much appreciated; without it, the range of statistics published by the ABS would not be possible. Information received by the ABS is treated in strict confidence as required by the Census and Statistics Act 1905.

The structure of the Australian Health Survey

Release schedule

Results from the Australian Health Survey have been released progressively from October 2012 and will continue into 2015. Please see the Australian Health Survey: Users' Guide, 2011-13 (cat. no. 4363.0.55.001) and the Australian Aboriginal and Torres Strait Islander Health Survey: Users' Guide, 2012-13 (cat. no .4727.0.55.002) for more information on the release schedule.

Previous catalogue number

This release previously used catalogue number 4364.0.55.007.
 

Back to top of the page