4130.0 - Housing Occupancy and Costs, 2013-14  Quality Declaration
Quality Declaration ARCHIVED ISSUE Released at 11:30 AM (CANBERRA TIME) 10/12/2015
Page tools:
 Print Page Print Page
 Print All Print All
| ||||||||||||||||||||||||||||||||||||||||||||||||||||||||||||||||||||||||||||||||||||||||||||||||||
HOUSING MOBILITY In 2013–14, 1.26 million households (14% of all households) moved house at least once in the previous 12 months. As shown in Graph 1, housing mobility is strongly related to the age of the household reference person. Over a third (35%) of households with a household reference person aged 15 to 34 years had spent less than 1 year in their current dwelling and 84% had spent less than 5 years. Households with a household reference person aged 65 years and over moved home less frequently with 4% of these households having spent less than 1 year in their current dwelling and 14% having spent less than 5 years. 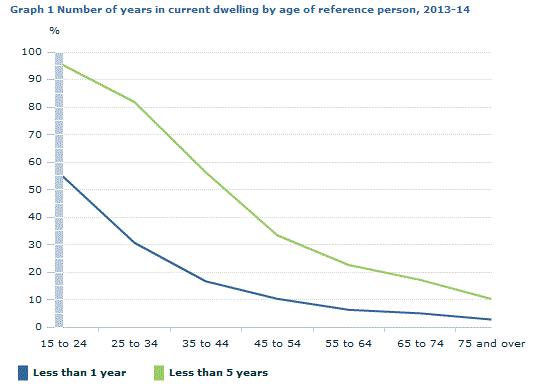 Source(s): Graph data SIH FREQUENCY OF MOVES As shown in Graph 2, households with a younger household reference person reported moving more frequently than other households. Some 39% of households with a reference person aged 15 to 34 years had moved three or more times in the previous 5 years.  Source(s): Graph data SIH MOBILITY AND TENURE Renters moved more frequently than home owners. As shown in Graph 3, over a third (35%) of private renter households had spent less than 1 year in their current dwelling and 81% had spent less than 5 years. Home owners moved less frequently with 6% reporting less than 1 year in their current dwelling and 26% less than 5 years. In comparison, 28% of home owner households and 15% of households renting from a state or territory housing authority reported living in their current dwelling for 20 years or more. 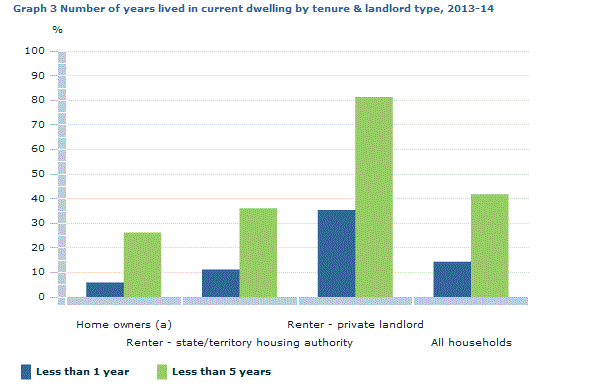 Footnote(s): (a) Includes owner without a mortgage and owner with a mortgage Source(s): Graph data SIH LOCALITY OF MOVE Most moves in the previous 5 years were within the same suburb or locality (48%) or same state or territory (but outside the same suburb or locality) (42%). However, 6% of households moved from a different state or territory and 4% moved from overseas to Australia. REASONS FOR MOVING Households who had moved home in the previous 5 years reported the main reasons for moving were wanting a bigger or better home (17%) and to purchase their own dwelling (16%). The main reasons for moving varied by household characteristics:
For households renting from a state or territory housing authority, the highest reported reason for moving was due to housing allocation (37%). BARRIERS TO MOVING FOR THOSE WHO WANTED TO MOVE In 2013–14, 10% of households reported that they would like to move house but were unlikely to move in the next 12 months. The main reasons reported for not moving were that they could not afford to buy a new dwelling (57%), could not afford the expenses associated with moving (23%) and that the move would be too much effort (19%). Document Selection These documents will be presented in a new window.
|
||||||||||||||||||||||||||||||||||||||||||||||||||||||||||||||||||||||||||||||||||||||||||||||||||
