 Quality Declaration
Page tools:
 Print Page Print Page
 Print All Print All
| |||||||||||||||||||||||||||||||||||||||||||||||||||||||||||||||||||||||||||||||||||||||||||||||||||||||||||||||||||||||||||||||||||||||||||||||||||||||||||||||||||||||||||||||||||||||||||||||||||||||||||||||||||||||||||||||||||||||||||||||||||||||||||||||||||||||||||||||||||||||||||||||||||||||||||||||||||||||||||||||||||||
|
AGE Median age The median age at death for suicide in 2012 was 44.6 years for males, 42.8 years for females and 44.1 overall. In comparison, the median age for deaths from all causes in 2012 was 78.6 years for males, 84.6 years for females and 81.7 years overall. Age-specific rates Age-specific death rates are the number of deaths during the reference year for specific age groups per 100,000 of the estimated resident population of the same age group (see Glossary for further information). The pattern of age-specific rates in 2012 for suicide in males and females is shown in the graph below.
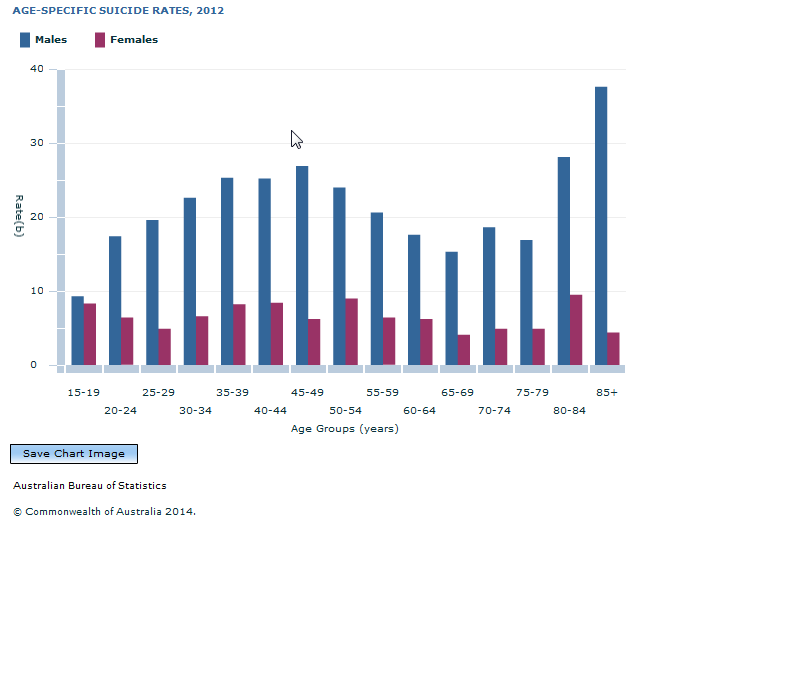 Footnote(s): a) Includes ICD-10 codes X60-X84 and Y87.0. Care needs to be taken in interpreting figures relating to suicide. See Explanatory Notes 92-94. (b) Rate per 100,000 estimated mid-year resident population for each age group and sex. (c) Causes of death data for 2012 are preliminary and subject to a revisions process. See Explanatory Notes 29-33 and Technical Notes, Causes of Death Revisions 2006, in Causes of Death, Australia, 2010 (cat. no. 3303.0) and Causes of Death Revisions 2010 and 2011 in this publication. Source(s): Causes of Death, Australia The highest age-specific suicide death rate for males in 2012 was observed in the 85 years and over age group (37.6 per 100,000 males). As a proportion of total male deaths in this age group, suicide deaths represented 0.3%. The second highest age-specific suicide rate was observed in the 80-84 year age group, with 28.1 suicide deaths per 100,000 males. Suicide as a proportion of total male deaths for this age group was 0.4%. Excluding the 0-14 year age group, the age-specific suicide rate for males was lowest in the 15-19 year age group (9.3 deaths per 100,000), however, this represented over a fifth of all deaths in this age group (21.9%). For females the highest age-specific suicide death rate in 2012 was observed in the 80-84 year age group, with 9.5 deaths per 100,000. Outside of the 0-14 year age group, the lowest age-specific death rate for female deaths was in the 65-69 year age group (4.1 deaths per 100,000). Age-standardised rates Age standardisation is used to compare death rates over time, as it accounts for any changes in the age-structure of a population over time. The age-standardised suicide rate for persons in 2012 was 11.0 per 100,000. This compares with 11.2 per 100,000 in 2003. The age-standardised suicide rate in 2012 for males was 16.8 per 100,000 while the corresponding rate for females was 5.5 per 100,000.  FOR SUICIDE(b), 2003-2012.gif) Footnote(s): (a) Age-standardised rate per 100,000. Standardised using direct method and the Australian estimated resident population (persons) at 30 June 2001 as standard population. (b) Includes ICD-10 codes X60-X84 and Y87.0. Care needs to be taken in interpreting figures relating to suicide. See Explanatory Notes 92-94. (c) All causes of death data from 2006 onward are subject to a revisions process - once data for a reference year are 'final', they are no longer revised. Affected data in this table are: 2006-2010 (final), 2011 (revised), 2012 (preliminary). See Explanatory Notes 29-33 and Technical Notes, Causes of Death Revisions, 2006 in Causes of Death, Australia, 2010 (cat. 3303.0) and Causes of Death Revisions, 2010 and 2011 in this publication. Source(s): Causes of Death, Australia Suicide by year of occurrence Sections 1-7 (including this section on suicide deaths) of the Causes of Death, Australia publication are based on year of registration data (e.g. when the death was registered). Section 8 is based on year of occurrence (e.g. the year the death actually occurred). For the 2012 reference year, 10.3 of deaths had a year of occurrence prior to 2012. This compares with the 2011 reference year where 7.0% of deaths occurred prior to 2010, and the 2010 reference year where 9.1% of deaths occurred prior to 2010. The number of deaths that are registered in any year will be different to the number of deaths that actually occurred in that year. Counts of specific causes of death (including suicide) based on year of occurrence are available for 2002-2011 in the Year of Occurrence datacube. The proportion of suicide deaths that occur in a previous reference period can impact the overall count of suicide deaths, along with coronial investigations not being finalised and the revisions process undertaken by the ABS. Suicide deaths of children and young people under the age of 15 The number of suicide deaths of children and young people under the age of 15 is small, but is significant in terms of the proportion of all deaths within this age group. The tables provided below show aggregate data for the 5 year period from 2008-2012. The age group published is for persons 5 to 14 years of age. This aligns with standards used elsewhere in the Cause of Death release and with those used by the World Health Organisation (WHO). The ABS is not aware of any recorded suicide deaths of children under the age of 5. Deaths of children by suicide is an extremely sensitive issue. The number of deaths of children attributed to suicide can be influenced by coronial reporting practices. Reporting practices may lead to differences in counts across jurisdictions and this should be taken into account when interpreting these data. For more information on issues associated with the compilation and interpretation of suicide data, see Explanatory Notes 92-94. The following two tables present the number of deaths from suicide by age group for the 2008-2012 reference period. Table 5.1 shows the number of deaths from suicide and age-specific death rates by age group and sex. Table 5.2 shows the number of deaths from suicide by age group and state or territory of usual residence. It is recognised that the death rate from suicide differs between Aboriginal and Torres Strait Islanders and non-Indigenous Australians. While not separately tabulated, it should be noted that of the 57 deaths by suicide of children and young people under the age of 15, 15 deaths (26.3%) were of Aboriginal and Torres Strait Islander Australians. The remaining deaths were of non-Indigenous persons or persons for whom Indigenous status was not stated.
Lifeline: 13 11 14 Suicide Call Back Service - 1300 659 467 Kids Helpline (for young people aged 5 to 25 years): 1800 55 1800 Document Selection These documents will be presented in a new window.
|
||||||||||||||||||||||||||||||||||||||||||||||||||||||||||||||||||||||||||||||||||||||||||||||||||||||||||||||||||||||||||||||||||||||||||||||||||||||||||||||||||||||||||||||||||||||||||||||||||||||||||||||||||||||||||||||||||||||||||||||||||||||||||||||||||||||||||||||||||||||||||||||||||||||||||||||||||||||||||||||||||||
