2071.0 - Census of Population and Housing: Reflecting Australia - Stories from the Census, 2016
ARCHIVED ISSUE Released at 11:30 AM (CANBERRA TIME) 28/06/2017
Page tools:
 Print Page Print Page
 Print All Print All
| |||||||||||||||||||||||||||||||||||||||||||||||||||||||||||||||||||||||||||||||||||||||||||||||||||||||||||||||||||||||||||||||||||||||||||||||||||||||||||||||||||||||||||||||||||||||||||||||||||||||||||||||||||||||||||||||||||||||||||||||||||||||||||||||||||||||||||||||||||||||||||||||
|
CULTURAL DIVERSITY IN AUSTRALIA, 2016 2016 CENSUS ARTICLE INTRODUCTION Since Federation, Australia's migration history has been shaped by government policy and world events. From mainly European migration and the 'White Australia Policy' of the early 20th Century, to the humanitarian resettlement programs developed after World War II and more recent conflicts, Australia has evolved into a nation of people from over 190 different countries and 300 different ancestries. Aboriginal and Torres Strait Islander peoples contribute greatly to the cultural diversity of Australia. While this article will focus on the overseas-born population, information on the Aboriginal and Torres Strait Islander population is available in the Aboriginal and Torres Strait Islander Population Data Summary. PEOPLE BORN OVERSEAS The 2016 Census of Population and Housing showed that more than a quarter (26%) of Australia's population (6,163,667 people) were born overseas, up from 25% in 2011. This continues a trend that has seen an increase in the number of overseas-born people living in Australia since the first Census in 1911 (excluding periods during both World Wars where migration to Australia stagnated). Of the overseas-born population, nearly one in five (18%) had arrived since the start of 2012. The ten most commonly reported countries of birth for those born overseas were:
While the most common birthplace for those born overseas remains England (15% of the overseas-born population), there has been an increase between the 2011 and 2016 Censuses in the proportion of people born in China (6.0% to 8.3%) and India (5.6% to 7.4%). The proportion of those born in New Zealand has decreased over the same period, dropping from 9.1% to 8.4% of the overseas-born population. Fifty years ago, in 1966, Australia's overseas-born population was only 18% of the total Australian population. At that time a third (32%) of this population was born in England, and only 1.6% came from India and China combined. 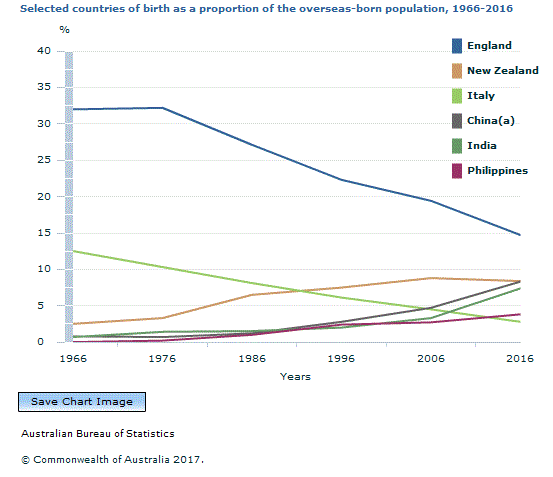 Footnote(s): (a) Excludes Special Administrative Regions and Taiwan Province. Source(s): Censuses of Population and Housing, 1966, 1976, 1986, 1996, 2006, 2016 The proportion of the overseas-born population arriving from countries outside of Europe and Asia also increased between 2011 and 2016. There was a rise in those born in the Middle East (4.5% to 4.9%), while people from Northern America represented 2.1% of the overseas-born population in 2016.
(b) Other Americas includes Central America, Caribbean and Americas, nfd. (c) Total includes Inadequately described, At sea, and North Africa and the Middle East, nfd. Source: Census of Population and Housing 2011, 2016 How do we compare with other countries? As of 2015, Australia had the 9th largest number of overseas-born people, higher than both Spain (10th) and Italy (11th).1 While the United States of America had the highest total number of people born overseas (47 million or 14% of their population),2 Australia had a higher proportion of overseas-born people, at 26%. Australia also had a higher proportion of people born overseas than our neighbour New Zealand (23%) and Canada (22%),3 other countries founded on migration. Proportion of population that are overseas migrants, 2015 Source: United Nations, Department of Economic and Social Affairs, Population Division, 'International Migration' in International migrant stock 20154 THE AGE AND SEX OF THE OVERSEAS-BORN POPULATION In 2016, the overseas-born population had a median age of 44 years compared with a median age of 34 years for the Australian-born population. This is influenced by the ageing of migrants who arrived under large-scale migration schemes following World War II. Age and sex distribution of the overseas-born and Australian-born populations, 2016 Source: Census of Population and Housing, 2016 Given the relatively recent increase in Asian migration, those born in Asia had a younger age profile with a median age of 35 years. By contrast, people born in Europe had a median age of 59 years. Age and sex distribution of the Asian-born and European-born populations, 2016 Source: Census of Population and Housing, 2016 THE ANCESTRIES OF AUSTRALIANS The ten most commonly reported ancestries were:
THE GENERATIONS OF AUSTRALIANS In 2016 nearly half (49%) of all Australians were either born overseas or had at least one parent who was born overseas.
Of the second generation Australians with both parents born overseas, those aged under 40 in 2016 were more likely to have both parents born in an Asian country. Those aged 40 and over were more likely to have both parents born in a European country. This is reflective of predominantly European migration through the 20th century, and the increase in migration from China, India, Vietnam and the Philippines since 1975. Age and sex distribution of the different generations, 2016 Source: Census of Population and Housing, 2016 PARENT'S COUNTRY OF BIRTH The 2016 Census was the first time that the country of birth of a person's mother and father had been collected. The top five countries of birth were the same for both mothers and fathers, and matched the top five countries of birth for the total population. The top five countries of birth for mothers and fathers in 2016 were:
RELIGION As time passes and the cultural make-up of society changes, so does the religious affiliations of the population. As Australia has seen an increase in the proportion of people born in non-European countries over the past 50 years, the religious make-up of its communities has diversified. While the overseas-born population were still predominantly Christian in 2016, more recent arrivals were less likely to identify as Christian.
Christian religions As in the past, Christianity was the main religion reported in the Census by both people born overseas and born in Australia. In 2016, 47% of those born overseas reported an affiliation with Christianity, compared with 58% of the Australian-born population. Of the overseas-born population who reported an affiliation with a Christian religion, 45% identified as Catholic and 18% as Anglican. This difference is similar to that in the Australian-born population (43% and 28% for Catholic and Anglican respectively). Other religions People born overseas were more likely to be affiliated with a religion other than Christianity than those born in Australia. In 2016, non-Christian religions were reported by 21% of the overseas-born population compared with 3.7% of the Australian-born population. For four of the top five non-Christian religions, there was a higher proportion who were born overseas than born in Australia. More than a third (36%) of people who reported being affiliated with Islam in 2016 were born in Australia. Judaism had a higher Australian-born than overseas-born population (53% compared with 47%).  Source(s): Census of Population and Housing, 2016 People born in Vietnam and China made up 40% of the overseas-born Buddhist population. India and Nepal contributed over three quarters (76%) of the overseas-born Hindu population, and Pakistan and Afghanistan provided the largest proportion of the overseas-born Islamic population (26%). No religion Nearly a third of Australians (30%) reported in the 2016 Census that they had no religion. It was more common to report having no religion than to have a non-Christian religion (8.2%). Those born in Australia were more likely to indicate they had no religion than those born overseas (34% compared with 27%). Of the overseas-born population who reported no religious affiliation, 22% were born in China, 20% were born in England and 14% were born in New Zealand. 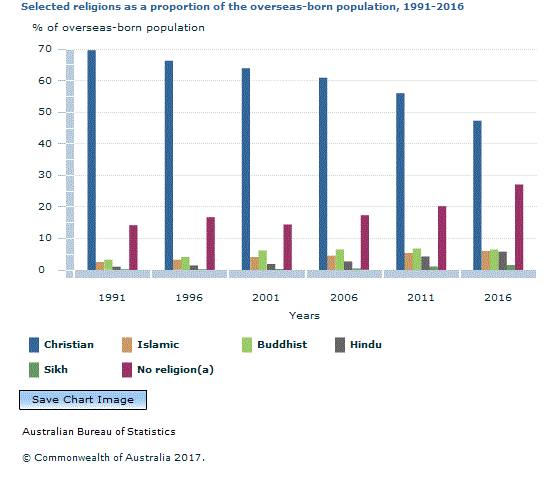 Footnote(s): (a) No religion includes secular beliefs (e.g. Atheism) and other spiritual beliefs (e.g. New Age). Source(s): Census of Population and Housing, 1991, 1996, 2001, 2006, 2011 and 2016 Further information on religion in Australia is available in the Religion data summary and Religion article. WHERE DO THE OVERSEAS-BORN POPULATION LIVE? The last 50 years have seen a shift in where the overseas-born population lives within Australia. While 61% of people born overseas live in New South Wales and Victoria, there has been a notable increase in the proportion who now call Queensland and Western Australia home.
Source: Census of Population and Housing, 1966 and 2016. In 2016, Sydney had the largest overseas-born population of all the capital cities (1,773,496), followed by Melbourne and Perth (1,520,253 and 702,545 respectively). Those born overseas were more likely to live in a capital city than Australian-born people. In 2016, 83% of the overseas-born population lived in a capital city. This is much higher than the Australian-born population (61%). Migrants who had arrived in the past 25 years were more likely to live in a capital city than had those who arrived before 1991 (86% compared with 78%). WHAT LANGUAGES ARE SPOKEN AT HOME? In Australia, there were over 300 separately identified languages spoken at home in 2016. While English remained the main language spoken, Census data showed that more than one-fifth (21%) of Australians spoke a language other than English at home. Mandarin remained the next most commonly spoken language (2.5% of the total population), but there have been increases in the proportion of the population speaking Hindi (from 0.5% to 0.7%) and Punjabi (from 0.3% to 0.6%).
Source: Census of Population and Housing, 2011 and 2016 Overseas-born population Over 40% of the overseas-born population spoke only English at home in 2016. Of those who spoke a language other than English at home:
Of the overseas-born people who had arrived in the past 25 years, 11% either did not speak English well, or at all in 2016. For earlier migrants (those arriving before 1991) this number was lower at 8.3%. People born in Australia While most people born in Australia spoke English at home (91%), 8.1% spoke another language. Apart from English, the most common languages spoken at home in 2016 were Greek (0.8%), Arabic (0.8%) and Italian (0.7%). While a majority of the Australian-born Italian speaking population (64%) and nearly half (49%) of the Australian-born Greek speaking population were aged 40 years or over, most of the Australian-born Mandarin and Arabic speaking populations were aged less than 40 (97% and 91% respectively). EDUCATION Australia had the third highest number of international students worldwide in 2016.5 According to the Census, 38% of students attending a university or other tertiary institution were born overseas. A smaller proportion of students who attended a technical or further educational institution were born overseas (36%). These numbers align with the National Strategy for International Education 2025, through which the government is seeking to promote Australia's excellence as a higher education provider globally.7 According to the 2016 Census, more than half (52%) of the people born overseas who were currently attending an educational institution were studying at a university or other tertiary institution, or a technical or further educational institution. In comparison, 23% of Australian-born students were attending these institutions. In line with the larger proportion of students studying at a level higher than school, a greater proportion of the overseas-born population aged 20-29 reported in the Census that they had completed Year 12 or equivalent (87% compared with 73% of the Australian born population). Going to school Children born overseas were more likely to attend a government school than children born in Australia (69% compared with 63%). Not going to school Very few Australian-born people have not been to school (0.2%). However in 2016, 2.1% of those born overseas who were of school age or older had not been to school at all. EXPLANATORY INFORMATION Median age is when half the population is older, while the other half is younger. FOOTNOTES 2. Ibid. 3. Ibid. 4. United Nations, Department of Economic and Social Affairs, Population Division, (2015). 'International Migration' in International migrant stock 2015. Accessed from <http://www.un.org/en/development/desa/population/migration/data/estimates2/estimatesmaps.shtml?1t1> on 24 May 2017. 5. Australian Government, Department of Education and Training, (2016). '2016 First half year student summary tables'. Accessed from <https://docs.education.gov.au/node/43241> on 24 May 2017. 6. Ibid. 7. Australian Government, Department of Education and Training, Council for International Education, (2017). 'National Strategy for International Education 2025'. Accessed from <https://www.education.gov.au/national-strategy-international-education> on 25 May 2017. Document Selection These documents will be presented in a new window.
|
||||||||||||||||||||||||||||||||||||||||||||||||||||||||||||||||||||||||||||||||||||||||||||||||||||||||||||||||||||||||||||||||||||||||||||||||||||||||||||||||||||||||||||||||||||||||||||||||||||||||||||||||||||||||||||||||||||||||||||||||||||||||||||||||||||||||||||||||||||||||||||||
