4517.0 - Prisoners in Australia, 2013  Quality Declaration
ARCHIVED ISSUE Released at 11:30 AM (CANBERRA TIME) 05/12/2013
Page tools:
 Print Page Print Page
 Print All Print All
| ||
|
MOST SERIOUS OFFENCE/CHARGE At 30 June 2013, the most common offences/charges for prisoners (either sentenced or unsentenced) were:
Together, these offences/charges accounted for three quarters (75%) of all prisoners in 2013. (Table 1) Sex For male prisoners (either sentenced or unsentenced), the most common offences/charges were:
For female prisoners (either sentenced or unsentenced), the most common offences/charges were:
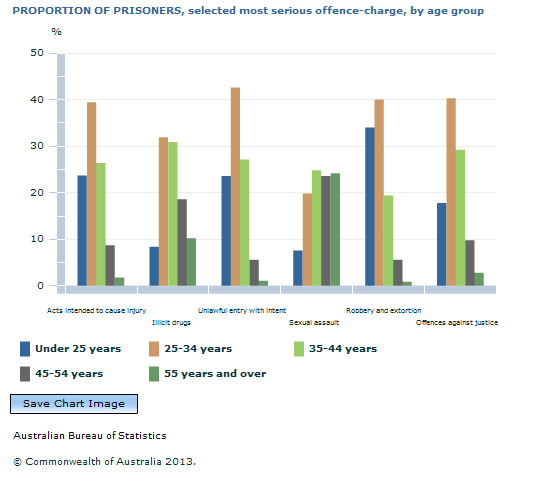
Age Prisoners aged 25 to 34 years (10,920 persons or 35% of prisoners) accounted for the highest proportion of prisoners for the following offences/charges:
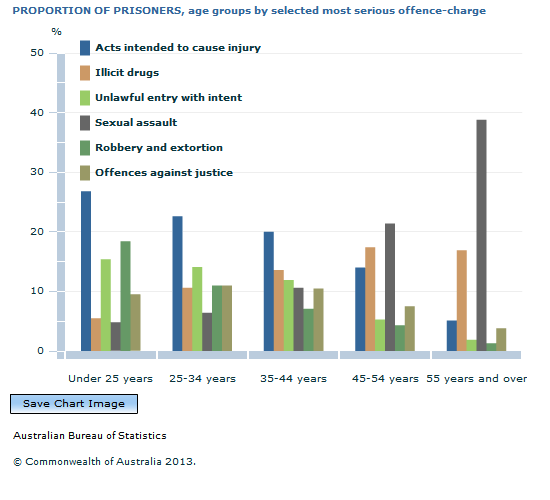
Prisoners aged 35 to 44 years accounted for the highest proportion of prisoners for homicide (29%) and sexual assault (25%).  Source(s): Prisoners in Australia The following graph shows that when comparing different offences across age groups:
 Source(s): Prisoners in Australia Document Selection These documents will be presented in a new window.
|
|
