Page tools:
 Print Page Print Page
 Print All Print All
| ||||||||||||||||||||||||||||||||||||||||||||||||||||||||||||||||||||||||||||||||||||||||||||||||||||||||||||||||||||||||||||||||||||||||||||||||||||||||||||||||||||||||||||||||||||||||||||||||||||||||||||||||||||||||||||||||||||||||||||||||||||||||||||||||||||||||||||||||||||||||||||||||||||||||||||||||||||||||||||||||||||||||||||||||||||||||||||||||||||||||||||||||||||||||||||||||||||||||||||||||||||||||||||||||||||||||||||||||||||||||||||||||||||||||||||||||||||||||||||||||||||||||||||||||||||||||||||||||||||||||||||||||||||||||||||||||||||||||||||||||||||||||||||||||||||||||||||||||||||||||||||||||||||||||||||||||||||||||||||||||||||||||||||||||||||||||||||||||||||||||||||||||||||||||||||||||||||||||||||||||||||||||||||||||||||||||||||||||||||||||||||||||||||||||||||||||||||||||||||||||||||||||||||||||||||||||||||||||||||||||||||||||||||||||||||||||||||||||||||||||||||||||||||||||||||||||||||||||
|
CONTENTS - Introduction - Migrants in Australia - Where do they live? - Sydney - Melbourne - Perth - Further information EXPLANATORY INFORMATION - Data sources and definitions - Endnotes Related terms migration, immigrants, immigration, migrant suburbs, migrant settlement, migrants in Australia, migrants in Sydney, migrants in Melbourne, migrants in Perth, international students INTRODUCTION Migration is an important contributor to Australia’s growing population. Since 2006, net overseas migration to Australia has contributed more to Australian population growth each year than growth through natural increase.1 The majority of migrants coming to Australia can choose to live anywhere, from the bustling city of Sydney to the remote mining towns of Western Australia, although government policies and programs may influence their destination.2 This article uses data from the ABS 2011 Census of Population and Housing to look at where migrants in Australia live. While migration to both urban and regional centres has had a key role in shaping Australia, this article focuses particularly on migrants living in Sydney, Melbourne and Perth, as these cities host three in five of Australia's migrants. MIGRANTS IN AUSTRALIA In the 2011 Census, there were 5.3 million migrants in Australia, which means one in every four (26%) Australian residents was born overseas. Australia’s migrant population is relatively large when compared with other Western nations. Taken as a proportion of the population, Australia has a larger migrant population than does New Zealand (23%), Canada (21%), the United States of America (13%) and the United Kingdom (13%). Out of Organisation for Economic Co-operation and Development (OECD) nations, only Luxemburg (42%), Israel (31%) and Switzerland (28%) have larger proportionate migrant populations. FOREIGN BORN AS A PERCENTAGE OF THE POPULATION IN SELECTED OECD NATIONS - 2010(a) Where are they from?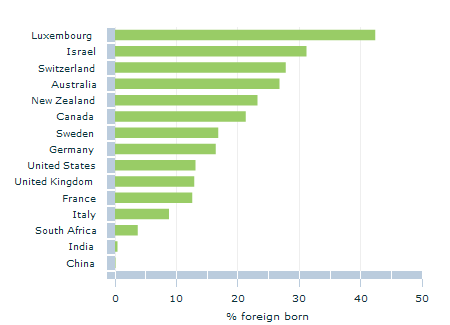 Footnote(s): (a) Data for 2010 or nearest year available. Source(s): Organisation for Economic Co-operation and Development Factbook 2013 The largest contributor to Australia's migrant population continues to be people born in the United Kingdom (UK). In the 2011 Census, 1.1 million UK-born migrants lived in Australia - around one in every twenty Australian residents. Migrants born in New Zealand were the second largest overseas-born population in Australia, at close to half a million people (483,000 people). This was followed by migrants born in China (319,000 people), India (295,000), Italy (185,000) and Vietnam (185,000). Cumulatively, migrants born in these six countries accounted for about half (49%) of all migrants in Australia in 2011. MIGRANTS IN AUSTRALIA BY COUNTRY OF BIRTH(a) - 2001 AND 2011 How long have they lived here?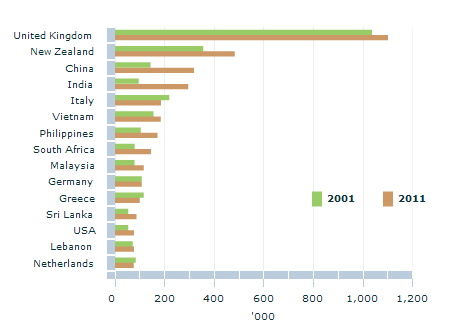 Footnote(s): (a) Top 15 countries of birth of overseas-born Australian residents The majority of migrants living in Australia are well established in the community, having been here for decades. In 2011, the median length of residence for migrants in Australia was 20 years. Length of residence in Australia differs markedly by country of birth, reflecting changing immigration trends over time. Migrants born in European nations like the Netherlands, Italy or Germany, for example, are some of the most established population groups in the country with median lengths of residence in Australia in excess of four decades. By contrast, migrants born in nations like China or India are relatively new arrivals to the country, reflecting the growing significance of migration to Australia from countries in Asia in recent decades.3 The median length of residence in Australia for migrants born in China and India was 8 years and 5 years respectively. MEDIAN LENGTH OF RESIDENCE IN AUSTRALIA BY COUNTRY OF BIRTH - 2011 WHERE DO THEY LIVE?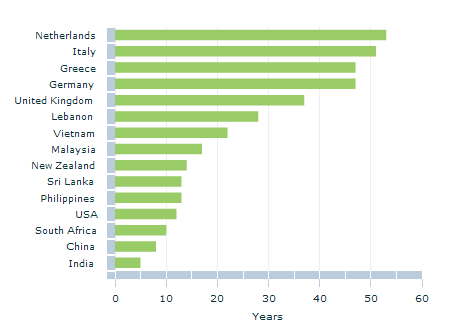 Source(s): ABS Census of Population and Housing, 2011 Most live in urban areas In comparison to people born in Australia, migrants show a tendency to settle in major urban areas of Australia. While 64% of Australian-born people lived in a major urban area of Australia in 2011, 85% of those born overseas lived in a major urban area. The extent to which migrants settled in urban areas differs by their country of birth. In 2011, some of the most urbanised population groups in Australia were migrants born in Somalia (98%), Lebanon (97%), Macau (97%), and the Former Yugoslav Republic of Macedonia (97%). Migrants born in nations like China (97%), Vietnam (97%), Greece (95%) and India (93%) were also highly urbanised. By contrast, migrants from New Zealand (78%), the United Kingdom (74%), Germany (72%) and the Netherlands (64%) tended to be less concentrated in major urban areas. They were still more likely, however, to live in a major urban area than people born in Australia. PEOPLE LIVING IN A MAJOR URBAN AREA BY COUNTRY OF BIRTH - 2011 In Sydney, Melbourne and Perth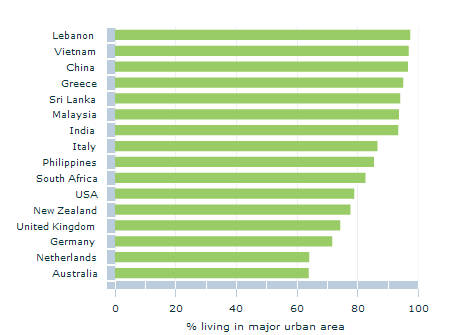 Source(s): ABS Census of Population and Housing, 2011 Within urban areas, migrants in Australia tended to live in Australia's two largest cities, a trend seen in Australia since the late 1940s.4 In the 2011 Census, just under half of all migrants in Australia lived in either Sydney or Melbourne, with 1.4 million residents of Sydney and 1.2 million residents of Melbourne being born overseas. Perth had the third largest migrant population in Australia at 568,000 people. MIGRANTS IN AUSTRALIAN CAPITAL CITIES - 2011 Sydney (39%), Melbourne (35%), and Perth (37%) were also the most popular cities for migrants when considered in proportional terms, with more than a third of the population in each of these cities being born overseas. Rates were lower for other mainland capital cities of Australia (between 25% and 27%), with Hobart having a notably smaller migrant population (15%).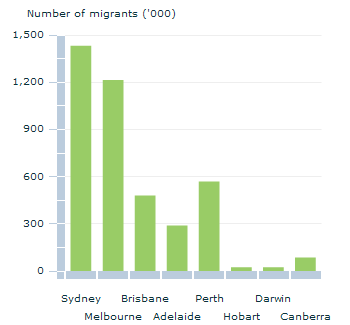 Source(s): ABS Census of Population and Housing, 2011 MIGRANTS IN AUSTRALIAN CAPITAL CITIES - 2011 In the inner city and near universities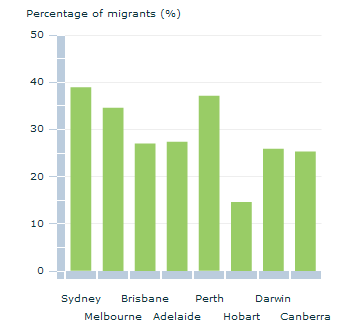 Source(s): ABS Census of Population and Housing, 2011 Across the Australian capitals, some common trends in settlement are evident. Suburbs located in or near city centres are strongly favoured by migrants. With the exception of Hobart and Darwin, the central business districts (CBDs) of every capital city in Australia had more than half its residents born overseas in 2011. Suburbs incorporating or situated near universities also featured high proportions of migrants. These include suburbs like Clayton (70%) in Melbourne, Robertson (62%) in Brisbane, Bentley and Crawley (both 62%) in Perth, Bedford Park (49%) in Adelaide, and Acton (57%) in Canberra. In some cities, new or redeveloped suburbs have attracted large numbers of migrants, such as Wolli Creek (68%) in Sydney, Jindalee (62%) in Perth and Franklin (44%) in Canberra. Other suburbs are significant areas of migrant settlement due to historical associations, such as Cabramatta (68%) in Sydney and St Albans (62%) in Melbourne which have relatively large populations of second generation migrants in addition to new arrivals. In a small number of cases, suburbs with large overseas-born populations do not necessarily reflect the settlement preferences of migrants. This is notable in the Darwin suburbs of Coonawarra (50%) and Eaton (44%) where large overseas-born populations reflect the fact that these suburbs contained immigration detention facilities. TOP SUBURBS(a) FOR MIGRANTS IN AUSTRALIA BY CAPITAL CITY - 2011
(a) Suburbs with the highest percentage of residents who were born overseas. Excludes suburbs with less than 100 usual residents. Source: ABS 2011 Census of Population and Housing A detailed breakdown of settlement patterns in Sydney follows. For detailed information on settlement patterns in Melbourne, skip to that section. For detailed information on settlement patterns in Perth, skip to that section. SYDNEY As the city with the largest overseas-born population in Australia, Sydney is an important entry point for many new arrivals to the country. Sydney is not only home to a number of established migrant communities, but also hosts a number of higher education institutions and businesses which draw in overseas migrants.5 In 2011, migrants tended to be most concentrated around a number of key urban centres in Sydney. In the inner city, a large majority of residents in the suburbs of Haymarket (88%), Sydney CBD (78%) and Ultimo (72%) were born overseas. Many of the migrants living in these suburbs were young students: in 2011, around one in every three people living in Haymarket and Ultimo was an international student attending University, TAFE or other further education institutions in Australia. To the west, high concentrations of people born overseas were found in Parramatta (70%) and surrounding suburbs like Harris Park (76%) and Westmead (68%). In the inner west nearer Sydney Olympic Park, Rhodes and Homebush West (both 73%) also had large concentrations of migrants, as did Burwood (68%). In the south west, suburbs with relatively large populations of migrants included Cabramatta (68%) and Fairfield (66%). These suburbs differed from others mentioned in that overseas-born residents tended to be more established in the community. The median length of residence in Australia for migrants living in Cabramatta was 19 years in 2011, more than three times that of migrants living in Haymarket (4 years), Harris Park (5 years), Parramatta or Rhodes (both 6 years). Other suburbs in Sydney with notable overseas-born populations in 2011 included Campsie (69%) in the Canterbury-Bankstown area, and Hurstville (67%) and Wolli Creek (68%) further south. The following map shows the proportion of overseas-born people in each suburb in Sydney. PERCENTAGE OF MIGRANTS IN SYDNEY BY SUBURB - 2011 Who are Sydney's largest migrant groups?(a) Suburbs with fewer than 100 usual residents have been excluded from analysis. Source: ABS 2011 Census of Population and Housing MIGRANTS IN SYDNEY BY COUNTRY OF BIRTH(a) - 2001 AND 2011 Patterns of settlement in Sydney by country of birth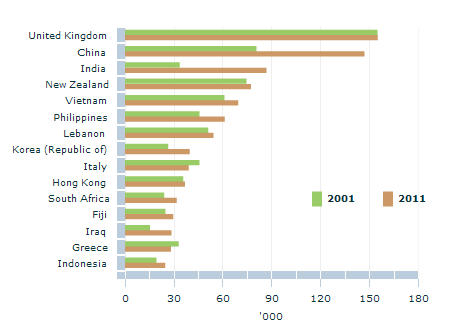 Footnote(s): (a) Countries of birth with the highest numbers of residents in Sydney Source(s): ABS Census of Population and Housing, 2001 and 2011 The United Kingdom Migrants born in the UK were the largest overseas-born group living in Sydney. In 2011, there were 155,000 UK-born migrants living in Sydney, comprising 4.2% of Sydney's total population. While other large migrant population groups tended to be more concentrated in southern and western suburbs of Sydney, the suburbs where UK migrants made up the largest proportion of the population were found in Sydney's north. These included Manly (16%), Fairlight (15%), and Queenscliff (14%), and suburbs around Pittwater such as Church Point (13%), Bayview (13%), and Scotland Island (12%). China Migrants born in China were the second largest overseas-born population group in Sydney, at 4% of Sydney’s total population in 2011 (147,000 people). Sydney suburbs where Chinese-born migrants made up the largest proportion of the population included Hurstville (36%), Rhodes (29%), Burwood (28%) and Allawah (24%) in the city's south and west. In the city centre, Ultimo and Haymarket also had relatively large populations of Chinese-born migrants (both 22%). India Indian-born migrants were the third largest population group in Sydney (87,000 people in 2011 or 2.4% of Sydney’s total population). Suburbs where Indian-born migrants were most densely concentrated tend to be situated in the wider Parramatta area including Harris Park (43%), Westmead (32%), and Parramatta (24%). Nearby suburbs of Wentworthville (19%), Girraween (17%), and Rosehill (16%) also had large proportions of their population born in India. In the last decade, the proportion of the population of Harris Park born in India more than tripled from 14% to 43% (an increase from 500 to 2,000 Indian-born people between 2001 and 2011). In Westmead, the increase was even greater, from 7% in 2001 to 32% in 2011 (from 700 to 4,200 Indian-born people). These increases reflect the wider increase seen in the Indian-born population across Sydney (and Australia) during this period, with the proportion born in India growing from 1.0% to 2.4% of Sydney's population between 2001 and 2011. New Zealand Although comprising the fourth largest overseas-born population group in Sydney in 2011 (77,000 people or 2.1% of Sydney’s total population), migrants born in New Zealand are a dispersed population. In 2011, there was no suburb in Sydney where New Zealand-born migrants made up more than 10% of the population (compared with 38 suburbs for Chinese migrants, 36 for UK migrants, and 10 for Indian migrants). Sydney suburbs with large concentrations of New Zealand-born migrants included Claymore (8%) towards Campbelltown, and Emerton (8%) and Tregear (6%) in the city's west. Interestingly, half of New Zealanders in Claymore and 42% of New Zealanders in Tregear reported having Samoan ancestry. Claymore and Tregear were also the suburbs with the first and third largest proportion of Samoan-born migrants in Sydney. SYDNEY SUBURBS WITH HIGHEST PERCENTAGE OF PERSONS BORN IN SELECTED COUNTRIES - 2011
Source: ABS 2011 Census of Population and Housing Vietnam, Cambodia and the PhilippinesCountries in eastern Asia including Vietnam (69,000 migrants) and the Philippines (61,000 migrants) also contributed significantly to the overseas-born population of Sydney in 2011. For migrants born in Vietnam, suburbs in the city's south west were most favoured, particularly Cabramatta (35%), Canley Vale (29%), Cabramatta West (28%) and Canley Heights (28%). These same suburbs also tended to be favoured by Cambodian-born migrants. Although smaller in population terms (11,000 migrants), around a third of all Cambodian-born migrants in Sydney lived in one of these suburbs in 2011. By contrast, migrants born in the Philippines tended to be most densely concentrated in suburbs in Sydney’s outer west. These included Woodcroft, where around a quarter (24%) of the population were Filipino-born, as well as Plumpton (19%) and Rooty Hill (18%). In fact, nine of the ten Sydney suburbs with the largest proportion of people born in the Philippines in 2011 were situated in the immediate area between Blacktown and Penrith. Other nations While other countries of birth contribute smaller numbers of people to the overall population of Sydney, the settlement patterns of some of these groups are also strongly localised. Lebanese-born migrants in Australia are very likely to have settled in Sydney with seven out of every ten living there in 2011. The suburbs where Lebanese migrants made up the largest proportion of the population were situated in the Bankstown area including Mount Lewis (18%), Punchbowl (16%), and Greenacre (15%). Suburbs north-west of these, such as South Granville (15%), Old Guildford (14%) and Guildford (13%), also had relatively large Lebanese-born populations. Korean-born migrants were also a large population group in Sydney. Suburbs where Korean-born migrants made up the largest proportion of the population were in the area around Olympic Park, including Rhodes (13%), Newington (12%) and Liberty Grove (11%). Meadowbank (11%) on the other side of the Parramatta river also had a comparatively large Korean-born population. Migrants born in Italy, on the other hand, tended to be concentrated in suburbs to the city’s inner west including Haberfield (15%), Wareemba (14%), and Five Dock (10%). Italian-born migrants were also found in suburbs to Sydney's outer south-west including Austral (13%) and Horsley Park (10%). For migrants born in South Africa, suburbs in the upper north shore including St Ives and St Ives Chase (both 12%) were favoured. Eastern suburbs including Dover Heights (15%) and Rose Bay (10%) were also favoured by South African-born migrants. Iraqi-born migrants were strongly concentrated in suburbs around Fairfield. In 2011, nearly one in four residents of Fairfield Heights (24%) and Fairfield (23%) was born in Iraq. Greenfield Park (16%) nearby also had a relatively large population of Iraqi-born migrants. For migrants born in Thailand or Indonesia, inner city suburbs of Haymarket (17% and 13% respectively) and Sydney CBD (9% and 12% respectively) were popular. Further south-west, Lakemba (15%) and Wiley Park (15%) were the suburbs with the largest population of Bangladeshi-born migrants in proportional terms. Migrants born in Fiji are a large population group in Sydney and tended to be most concentrated in suburbs to the outer south west like Hoxton Park (10%) and Prestons (8%). Nepalese-born migrants - one of the fastest growing migrant groups in Australia - were most concentrated in Rockdale (8%) and Kogarah (7%). MELBOURNE Melbourne is an attractive city for migrants. With a legacy of settling Anglo-Celtic, southern European, and Asian migrants over its more than 150 year history, Melbourne promotes itself as a diverse city that provides education and employment opportunities to new arrivals.6 Migrants in Melbourne are most concentrated around three regions of the city. In the city centre, close to two-thirds of the residents of Melbourne CBD (68%), Carlton (63%), and Southbank (61%) were migrants in 2011. The close proximity of these suburbs to the University of Melbourne, RMIT University, and a range of other higher education providers makes them especially popular with international students. In 2011, a quarter of the population of Melbourne CBD and a third of the population of Carlton were international students. To the city’s south-east, Clayton (70%), Clayton South (65%), Springvale (69%), Springvale South (59%), Noble Park (60%), and Dandenong (67%) were also strongly populated with migrants. Although these suburbs are close to each other, the characteristics of migrants within them varied. In Clayton, for example, migrants tended to be younger, more recent arrivals to the country with a median age of 27 years and a median length of residence in Australia of 4 years (Clayton also has a campus of Monash University). This contrasts with neighbouring Springvale and Springvale South where the migrant population was older (median age 40 years and 42 years respectively) and more established in the community (median length of residence 15 and 19 years respectively). To the west of the city, the suburbs of St Albans (62%), Sunshine North (58%) and Braybrook (57%) also had large proportions of people born overseas. Significant countries of birth for migrants in these suburbs included Vietnam, India and Malta. The following map shows the proportion of overseas-born people in each suburb in Melbourne. PERCENTAGE OF MIGRANTS IN MELBOURNE BY SUBURB - 2011 Who are Melbourne's largest migrant groups?(a) Suburbs with fewer than 100 usual residents have been excluded from analysis. Source: ABS 2011 Census of Population and Housing MIGRANTS IN MELBOURNE BY COUNTRY OF BIRTH(a) - 2001 AND 2011 Patterns of settlement in Melbourne by country of birth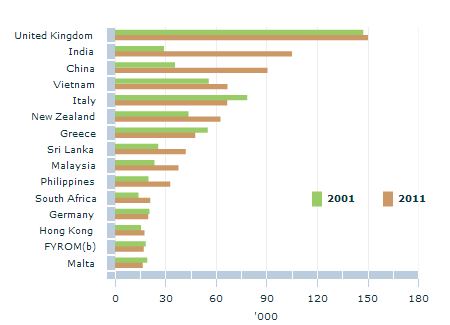 Footnote(s): (a) Countries of birth with the highest numbers of residents in Melbourne. (b) Former Yugoslav Republic of Macedonia. Source(s): ABS Census of Population and Housing, 2011 The United Kingdom At just over 150,000 people, migrants born in the United Kingdom were the largest overseas-born population group in Melbourne, accounting for 4.3% of the city’s total population in 2011. The suburbs of Melbourne where UK-born migrants were most concentrated were found to the city’s south-east and along the Mornington Peninsula. These included Bangholme (20%) where one in five people was born in the UK, and the beach side suburbs of Mount Eliza (13%), Mornington (13%), Mount Martha (13%) and Safety Beach (12%) on the peninsula. India Indian-born migrants were the second largest overseas-born population group in Melbourne comprising 3% of the city’s total population. The number of Indian-born migrants living in Melbourne grew considerably over the past decade, more than tripling from 29,000 people in 2001 to 105,000 people in 2011. Melbourne suburbs where Indian migrants made up relatively large proportions of the population were spread across many areas of the city. In the south-west, relatively large populations were found in Laverton and Williams Landing (both 15%). Glen Huntly (15%) to the city’s south-east, Albion (15%) in the west and Sydenham (11%) in the far north-west also had relatively large Indian populations, as did Clayton South (15%), Dandenong (12%) and Springvale (11%) further out in the south east. China Migrants born in China were also a large and growing population group in Melbourne. Similar to Indian-born migrants, the number of Chinese-born migrants living in Melbourne grew considerably in the past decade, more than doubling between 2001 and 2011 (from 36,000 to 90,000 people). Areas of Melbourne where Chinese-born migrants were most strongly concentrated were in Melbourne’s CBD (13%) and in a number of suburbs to the city’s east. These included Box Hill (22%), Box Hill North (12%), Burwood (12%) and Burwood East (11%). Clayton (18%) and Notting Hill (12%) further south also had relatively large Chinese-born populations. Vietnam Vietnamese-born migrants were strongly represented in suburbs to Melbourne’s west. Of the ten Melbourne suburbs in 2011 with the highest proportion of people born in Vietnam, eight were located in Melbourne’s west. In Sunshine North (25%) and Braybrook (23%), around a quarter were Vietnamese-born in 2011. Nearby Cairnlea (19%), St Albans (17%), and Maidstone (17%) also had large Vietnamese-born populations. In 2011, one in every five residents of Springvale (22%) and Springvale South (19%) in the city’s south-east was also born in Vietnam. MELBOURNE SUBURBS WITH HIGHEST PERCENTAGE OF PERSONS BORN IN SELECTED COUNTRIES - 2011
Source: ABS 2011 Census of Population and Housing New ZealandIn Melbourne, while people born in New Zealand were a large component of the overseas-born population, their settlement patterns were fairly dispersed. In 2011, no Melbourne suburbs had New Zealand-born migrants comprise more than 10% of the population (compared with 9 suburbs for UK-born migrants and 12 suburbs for Indian-born migrants). The suburbs with the highest proportions of people born in New Zealand were Truganina (6%) and Tarneit (5%) in the west, and Cranbourne West (5%) in the outer south-east. Italy, Greece and Malta Despite proportionally declining in size in recent decades, people born in southern European nations remain a significant component of Melbourne’s migrant community. In 2011, 67,000 residents of Melbourne were born in Italy and 48,000 were born in Greece. Migrants born in Italy were prominently settled in Keilor Park (15%), Avondale Heights (12%) and Airport West (9%) in the city's north-west, and Fawkner (14%) to the north. Greek-born migrants were most prominently found in Clarinda, Hughesdale, Clayton South, Oakleigh, and Oakleigh South (all 6%), all of which are located in the city’s south-east. Although smaller in population terms (16,400 people in 2011), Maltese-born migrants are also a prominent southern-European migrant group in Melbourne. Maltese-born migrants tended to be most concentrated in suburbs to the city’s west in 2011, including Sunshine North, Sunshine West, Ardeer, and St Albans (all 5%). Other nations Other regions of Melbourne contain notable pockets of settlement by migrants. Sri Lankan-born migrants made up a relatively large proportion of the population in the Dandenong area, particularly Dandenong (7%) and Noble Park (6%). Lyndhurst (7%) nearby also had a relatively large Sri Lankan-born population. Migrants born in Malaysia tended to settle in suburbs closer to the city centre, such as Carlton (10%) and Melbourne CBD (9%). Inner city suburbs were also favoured by Indonesian migrants. In 2011, the top suburbs of settlement for migrants born in Indonesia were Southbank (8%) and Melbourne CBD (6%). Settlement in these suburbs largely reflects the international student population particularly in Carlton and Melbourne CBD where more than half of all Malaysian-born and Indonesian-born migrants were students. By contrast, Filipino-born migrants were most strongly concentrated in suburbs to the city’s outer west. These included the newly developed suburb of Derrimut (9%), and Burnside (7%) and Burnside Heights (7%) to its north. To the north of the city, migrants born in Middle Eastern nations were prominent. This includes Iraqi-born migrants who were concentrated in Campbellfield (14%), Roxburgh Park (13%), and Coolaroo (11%). Campbellfield also hosted a relatively large population of Lebanese-born migrants (8%), while Dallas (16%) and Meadow Heights (14%) nearby had large proportions of Turkish-born migrants. In the south east of the city, Caulfield (6%) and Caulfield South (7%) had relatively large populations of South African-born migrants. Further out from the city, Dandenong South (12%) had relatively large populations of Afghani-born migrants, while Springvale South (13%) had one in eight of its population born in Cambodia. PERTH Perth is an increasingly important site of migrant settlement in Australia. Between the 2001 and 2011 Censuses, the number of migrants living in Perth grew 51%, higher than the growth seen in either Sydney (24%) or Melbourne (31%) during the same period.Perth suburbs with large concentrations of overseas-born populations were located near the city centre, to the south-east, and to the city's far north. In the city centre, this included Northbridge (68%), Perth CBD (57%), and East Perth (61%) where more than half of residents were born overseas. In the city's south east, suburbs with large migrant populations included Bentley (62%), Cannington (61%), Karawara (57%) and Queens Park (55%). The large population of migrants found in Karawara and Bentley reflect the fact these suburbs host student accommodation for Curtin university. In 2011, almost one in four residents of these suburbs was an international student attending University, TAFE, or other further education institution in Australia. To the far north of the city, growing populations of migrants were seen in newly developed beachside suburbs. More than half of all residents in Jindalee (62%), Mindarie (55%) and Iluka (54%) were overseas-born. Other suburbs with large overseas-born populations included Crawley (62%) which hosts the University of Western Australia, and Glendalough (56%) to the north-west of the city. The following map shows the proportion of overseas-born people in each suburb in Perth. PERCENTAGE OF MIGRANTS IN PERTH BY SUBURB - 2011 Who are Perth's largest migrant groups?(a) Suburbs with fewer than 100 usual residents have been excluded from analysis. Source: ABS 2011 Census of Population and Housing MIGRANTS IN PERTH BY COUNTRY OF BIRTH(a) - 2001 AND 2011 Patterns of settlement in Perth by country of birth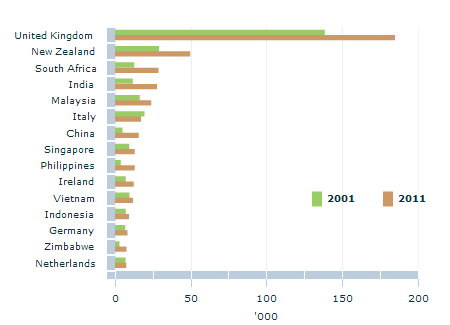 Footnote(s): (a) Countries of birth with the highest numbers of residents in Perth Source(s): ABS Census of Population and Housing, 2001 and 2011 The United Kingdom Around one in every eight residents of Perth was born in the UK (12% or 184,000 people). This is the largest overseas-born population group living in Perth by quite a margin, and the largest overseas-born population group found in any capital city in Australia. While migrants born in the UK were spread across the city, they were prominently found in the northern suburbs. Seventeen of the twenty Perth suburbs with the largest concentrations of UK-born migrants were in the area to Perth's north, including Jindalee (43%), Mindarie (34%), and Connolly (33%). Southern coastal suburbs also had large proportions of UK-born migrants. One in four residents in Secret Harbour (26%), East Rockingham (26%), and Calista (24%) were UK-born in 2011. New Zealand, South Africa and India As with Sydney and Melbourne, migrants born in New Zealand were spread across a number of suburbs in Perth. Suburbs with the largest proportion of persons born in New Zealand included Leda (8%) and Cockburn Central (7%) to the city's south, and Midvale (7%) to the east. South African-born migrants were similar to Perth's UK-born migrants in that they were concentrated in suburbs to the city's north. This included the Joondalup suburbs of Jindalee (9%), Iluka (8%), Burns Beach and Mindarie (both 7%). While the populous Perth suburbs of Canning Vale, Dianella and Duncraig had the largest South African-born communities in terms of numbers (around 1,100, 900 and 600 people respectively), as a proportion they were only about 4%. Migrants born in India tended to live in suburbs in Perth’s inner north-west, including Glendalough (15%) and Osborne Park (9%). Cannington in the inner south east also had a large Indian-born population (8%). PERTH SUBURBS WITH HIGHEST PERCENTAGE OF PERSONS BORN IN SELECTED COUNTRIES - 2011
Source: ABS 2011 Census of Population and Housing Malaysia, China and VietnamA number of Asian nations contributed to Perth's population. For migrants born in Malaysia, suburbs with relatively large proportions were found to the south east of the city. This included Karawara (11%) and Bentley (10%) near Curtin university. These suburbs also had high proportions of people born in China (accounting for 7% of the population of both suburbs), while one in ten residents of Crawley (10%), another university suburb, was Chinese-born. Migrants born in Vietnam were most strongly concentrated in Mirrabooka (9%) and Marangaroo (8%) in the city's north. FURTHER INFORMATION The settlement patterns and characteristics of migrants in Australia are important in informing decision making by governments, policy makers and service providers. To fulfil client needs in this area, the ABS provides a range of statistical products and services. Census information on overseas-born groups can be accessed through the ABS Census TableBuilder product, the Quickstats Country of Birth page, or through the ABS's Census Country of Birth Profiles available for each state and territory in Australia (catalogue numbers 2010.1 through 2010.8). In the coming months, more detailed information from the Census will also be produced as part of the ABS Migrants Census Data Enhancement (CDE) Project. A wide range of migrant statistics from other sources is also available free to users through the ABS website. For an overview of the types of statistics available, users are encouraged to visit the Migrant and Ethnicity Topics at a Glance portal.EXPLANATORY INFORMATION
ENDNOTES 1. ABS 2013 Australian Demographic Statistics (cat. no. 3101.0); ABS Australian Historical Population Statistics, 2008 (cat. no. 3105.0.65.001). 2. Migrants permitted entry to Australia under a range of State Specific and Regional Migration (SSRM) initiatives may have limitations placed on where they can live or work, at least initially. For further information, see the Department of Immigration and Border Protection's Fact Sheet 26 - State Specific Regional Migration. 3. ABS 2012 Reflecting a Nation: Stories from the 2011 Census, 2012-2013 (cat. no. 2071.0) 4. Hugo, G, 2011, 'Changing spatial patterns of immigrant settlement' in Multiculturalism and integration: a harmonious relationship, ANU E press, p18. 5. City of Sydney 'Our global city' last viewed 5 December 2013 <www.cityofsydney.nsw.gov.au> 6. City of Melbourne 'Multicultural communities' last viewed 5 December 2013 <www.melbourne.vic.gov.au> Document Selection These documents will be presented in a new window.
|
|||||||||||||||||||||||||||||||||||||||||||||||||||||||||||||||||||||||||||||||||||||||||||||||||||||||||||||||||||||||||||||||||||||||||||||||||||||||||||||||||||||||||||||||||||||||||||||||||||||||||||||||||||||||||||||||||||||||||||||||||||||||||||||||||||||||||||||||||||||||||||||||||||||||||||||||||||||||||||||||||||||||||||||||||||||||||||||||||||||||||||||||||||||||||||||||||||||||||||||||||||||||||||||||||||||||||||||||||||||||||||||||||||||||||||||||||||||||||||||||||||||||||||||||||||||||||||||||||||||||||||||||||||||||||||||||||||||||||||||||||||||||||||||||||||||||||||||||||||||||||||||||||||||||||||||||||||||||||||||||||||||||||||||||||||||||||||||||||||||||||||||||||||||||||||||||||||||||||||||||||||||||||||||||||||||||||||||||||||||||||||||||||||||||||||||||||||||||||||||||||||||||||||||||||||||||||||||||||||||||||||||||||||||||||||||||||||||||||||||||||||||||||||||||||||||||||||||||
4102.0 - Australian Social Trends, 2014
ARCHIVED ISSUE Released at 11:30 AM (CANBERRA TIME) 18/03/2014 Final
This page last updated 26 August 2014
