NET OVERSEAS MIGRATION
Net overseas migration (NOM) is the net gain or loss of population through immigration to Australia and emigration from Australia. Data provided by the Department of Immigration and Border Protection (DIBP) is used by the Australian Bureau of Statistics (ABS) to calculate the official NOM estimates each quarter.
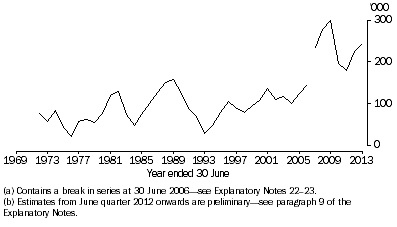
In 2012-13, NOM increased from the previous year reaching an annual estimate of 244,400 persons, which was 8.6% (19,300 persons) more than in 2011-12. NOM in 2011-12 was 225,100 persons, which was 24.8% (44,700 persons) more than the dip experienced in 2010-11 when NOM added 180,400 persons to Australia for the year.
2.1 Net Overseas Migration (NOM)(a)(b) - Australia
In 2012-13, NOM contributed the greatest number of people to the most populous states: New South Wales with a net increase of 67,800 persons, followed by Victoria (60,600), Western Australia (51,800) and Queensland (45,100). Tasmania had the lowest net increase with 1,400 persons (see Table 2.2). For the most up-to-date official estimates of NOM by state and territory produced by the ABS see
Australian Demographic Statistics Quarterly (cat. no. 3101.0). For the most up-to-date forecasts of NOM produced by DIBP see
The Outlook for Net Overseas Migration: September 2013 at:
http://www.immi.gov.au/media/publications/statistics/
2.2 NOM, Selected characteristics - State & territory - 2012-13(a) |
|
 | NOM | NOM ARRIVALS | NOM DEPARTURES |
| | | Overseas arrivals | Median age | Sex ratio(b) | Overseas departures | Median age | Sex ratio(b) |
| State or territory | no. | % | no. | years | ratio | no. | years | ratio |
|
| NSW | 67 784 | 27.7 | 160 324 | 27.2 | 100.6 | 92 540 | 29.3 | 102.3 |
| Vic. | 60 632 | 24.8 | 122 240 | 26.6 | 100.2 | 61 608 | 28.0 | 104.6 |
| Qld | 45 104 | 18.5 | 98 428 | 26.5 | 100.8 | 53 324 | 28.2 | 106.4 |
| SA | 11 622 | 4.8 | 23 076 | 27.0 | 102.0 | 11 454 | 27.7 | 105.8 |
| WA | 51 809 | 21.2 | 84 874 | 27.1 | 108.7 | 33 065 | 28.7 | 117.9 |
| Tas. | 1 385 | 0.6 | 3 817 | 27.8 | 105.4 | 2 432 | 28.7 | 106.8 |
| NT | 3 065 | 1.3 | 6 997 | 28.2 | 127.0 | 3 932 | 29.9 | 139.2 |
| ACT | 2 968 | 1.2 | 8 902 | 27.7 | 99.0 | 5 934 | 28.5 | 107.6 |
| Australia(c) | 244 371 | 100.0 | 508 662 | 26.9 | 102.2 | 264 291 | 28.6 | 106.3 |
|
| (a) Estimates from June quarter 2012 onwards are preliminary - see paragraph 9 of the Explanatory Notes. |
| (b) Males per 100 females. |
| (c) Includes Other Territories. |
An individual's actual travel behaviour and associated characteristics, including visa type, are only available from final NOM data, as these can only be accurately determined at the end of the 16 month reference period following a traveller's initial border crossing.
The Australian Department of Immigration and Border Protection (DIBP) manages and grants visas each year in accordance with relevant legislation, government planning and policy. It is important to note that there is a difference between when and how many visas are granted by DIBP; and when and how they may impact on NOM, and therefore Australia's estimated resident population (ERP). For example, for many visas there can be a lag between a visa being granted and the actual use of that visa by the applicant on entering Australia. Also, some travellers who have been granted permanent or long-term temporary visas may end up staying in Australia for a short period of stay or not at all. In addition, travellers may also apply for, and be granted, a different visa whilst in Australia or overseas. However, without an additional border crossing within the reference quarter to capture a traveller's change of visa, the NOM system is unable to incorporate these occurrences.
Table 2.3 shows a breakdown of the types of visa groups which have contributed to final NOM. It shows that temporary visa holders are still the main contributors to NOM in the 2011 calendar year.
2.3 NOM, by major groupings and visa(a) - Australia - 2011 |
|
| | NOM ARRIVAL | NOM DEPARTURE | NOM |
| | | | | | | |
| Major groupings and visa | no. | % | no. | % | no. | % |
|
| Temporary visas | 217 055 | 47.6 | 115 246 | 46.0 | 101 809 | 49.5 |
| Vocational education and training sector | 10 720 | 2.3 | 10 476 | 4.2 | 244 | 0.1 |
| Higher education sector | 41 886 | 9.2 | 30 894 | 12.3 | 10 992 | 5.3 |
| Student other | 21 386 | 4.7 | 8 478 | 3.4 | 12 908 | 6.3 |
| Temporary work skilled (subclass 457) | 42 015 | 9.2 | 12 459 | 5.0 | 29 556 | 14.4 |
| Visitor(b) | 43 964 | 9.6 | 17 246 | 6.9 | 26 718 | 13.0 |
| Working holiday | 50 576 | 11.1 | 14 954 | 6.0 | 35 622 | 17.3 |
| Other temporary visas | 6 508 | 1.4 | 20 739 | 8.3 | -14 231 | -6.9 |
| Permanent Visas | 79 191 | 17.4 | 12 012 | 4.8 | 67 179 | 32.7 |
| Family | 33 700 | 7.4 | 4 058 | 1.6 | 29 642 | 14.4 |
| Skill | 36 231 | 7.9 | 7 869 | 3.1 | 28 362 | 13.8 |
| Special eligibility and humanitarian | 9 260 | 2.0 | 85 | - | 9 175 | 4.5 |
| New Zealand citizen (subclass 444) | 59 539 | 13.0 | 16 263 | 6.5 | 43 276 | 21.0 |
| Australian citizen | 77 600 | 17.0 | 86 129 | 34.4 | -8 529 | -4.1 |
| Other(c) | 22 873 | 5.0 | 20 929 | 8.4 | 1 944 | 0.9 |
| Total | 456 258 | 100.0 | 250 579 | 100.0 | 205 679 | 100.0 |
|
| - nil or rounded to zero (including null cells) |
| (a) The visa category information in this table represents the number of visas based on the visa type at the time of a traveller's specific movement. It is this specific movement that has been used to calculate NOM. Therefore, the number of visas in this table should not be confused with information on the number of visas granted by DIBP |
| (b) Visitor visas include tourists, business visitors, medical treatment and other. |
| (c) Includes residents returning (i.e. non Australian citizens who have a permanent resident visa) and visa unknown. |
 Quality Declaration
  Print Page
 Print All