Page tools:
 Print Page Print Page
 Print All Print All
| ||
|
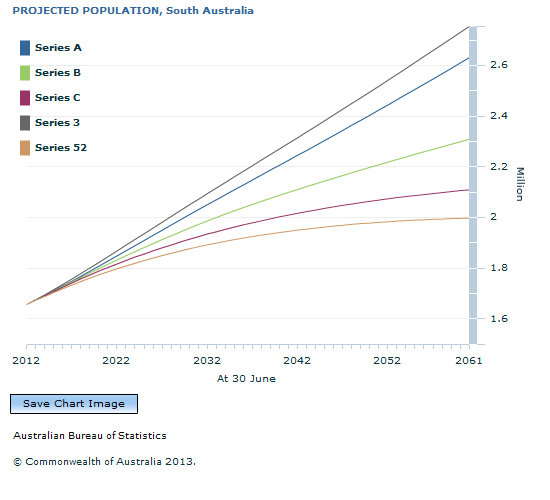
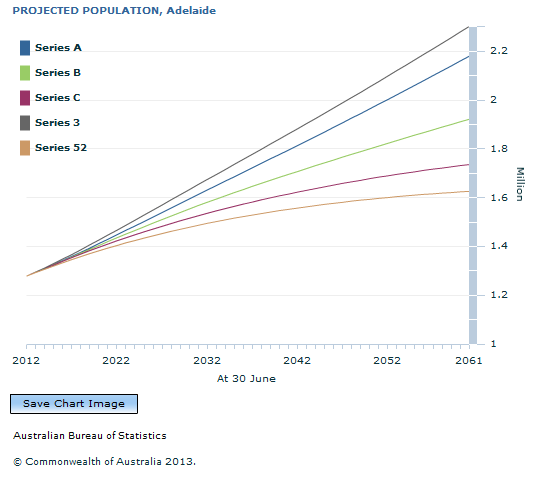
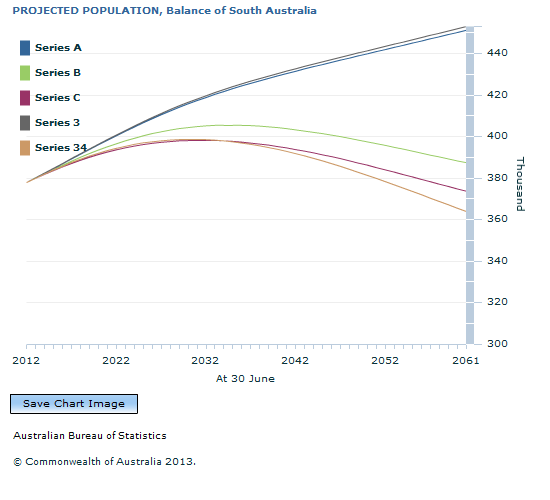
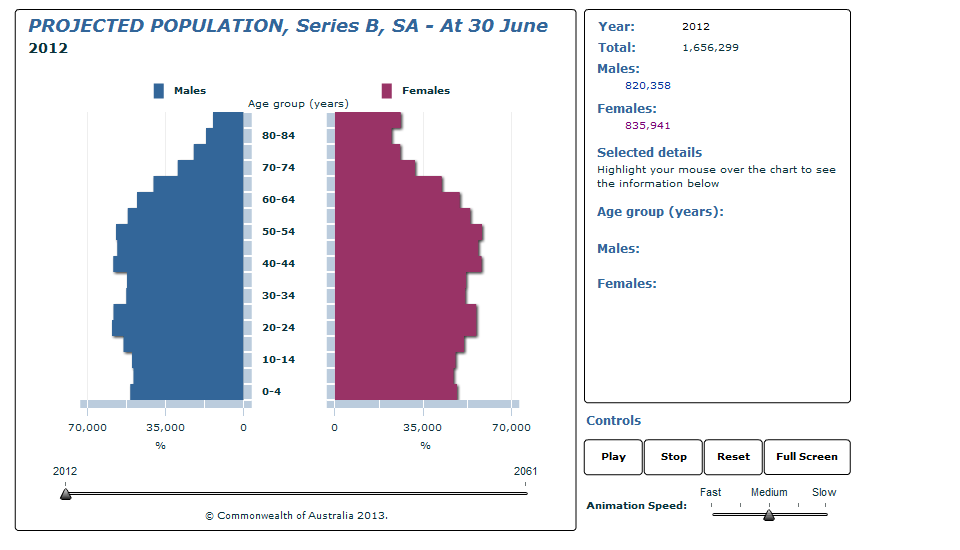
Population size Series A projects the largest population for South Australia, increasing from 1.7 million at 30 June 2012 to 2.6 million in 2061. Series B projects an increase to 2.3 million people, while the smallest population (2.1 million) is projected in Series C. Adelaide's population is projected to increase continuously in the three main series from 1.3 million at 30 June 2012 to between 1.7 million and 2.2 million in 2061. In two of the three main series the population of the balance of South Australia is projected to increase, from 377,900 at 30 June 2012 to 387,400 (Series B) and 451,200 (Series A) in 2061. In Series C, the population is projected to increase marginally over the next twenty years, peaking at 398,100 in 2033, before declining to 373,700 in 2061. Age/sex structure At 30 June 2012 the median age of South Australia's population was 39.6 years, the second highest of the states and territories. By 2061 the median age is projected to increase to between 43.2 years and 46.6 years. The graph below presents the age structure for South Australia in 2012 and 2061. Births and Deaths In 2011-12, there were 20,300 births and 12,800 deaths in South Australia, resulting in natural increase of 7,500 people. In Series A and B, births will continue to exceed the number of deaths (natural increase), during the projection period. In Series C, deaths will first exceed the number of births in 2036-37 until the end of the projection period. Alternative scenarios to Series A, B and C The combination of assumptions in Series 3 results in the largest population for South Australia in 2061 (2.8 million people). This is due to the relatively small interstate migration losses assumed for South Australia (a net –2,000 people per year) in this series. Conversely, Series 52, which assumes the greatest interstate migration losses for South Australia (a net –4,000 people per year) projects the smallest population by 2061 (2.0 million people). Similarly, Series 3 projects the highest population for Adelaide (2.3 million people in 2061) and Series 52 projects the smallest population (1.6 million people).
Document Selection These documents will be presented in a new window.
|
|
3222.0 - Population Projections, Australia, 2012 (base) to 2101  Quality Declaration
ARCHIVED ISSUE Released at 11:30 AM (CANBERRA TIME) 26/11/2013
This page last updated 21 November 2018


