FEATURE ARTICLE 1: OVERSEAS STUDENT ENROLMENTS WITH HIGHER EDUCATION PROVIDERS
In 2008, there were 294,163 overseas student enrolments across all higher education providers in Australia. This represented a 40% increase in overseas student enrolments from 2003 and a 7.7% increase from 2007. Overseas students studying with higher education providers made up 28% of the 1,066,095 student enrolments in 2008.
Over the past two decades, increasing numbers of overseas students have come to Australia. Exporting education has played a major role in forging links with other countries, especially from Asia (from where the majority of overseas students originate). A diverse student population helps to foster cultural exchange and understanding among students. Some overseas students also add to our skilled labour supply by becoming permanent residents after finishing their studies.
Country of birth
Overseas students in higher education are born in a diverse range of countries. In 2008, the most common countries of birth for these students were China, Malaysia, India and Singapore (table 12.22). Between 2003 and 2008 the number from China and India doubled and the number from Vietnam tripled. Of the other main countries of birth, the number from Singapore, Indonesia and the United States of America remained stable while students from Hong Kong reduced by 25%.
12.22 OVERSEAS STUDENTS IN HIGHER EDUCATION, By country of birth - top 10 |
|
 | Students 2003 | Students 2008 | change on 2003 |
| Student country of birth | no. | no. | % |
|
| China (excludes SARs and Taiwan Province) | 30 086 | 66 494 | 121.0 |
| Malaysia | 26 968 | 31 135 | 15.5 |
| India | 12 332 | 27 618 | 124.0 |
| Singapore | 26 711 | 26 553 | -0.6 |
| Hong Kong (SAR of China) | 27 193 | 20 292 | -25.4 |
| Indonesia | 12 128 | 11 844 | -2.3 |
| Vietnam | 3 157 | 9 904 | 213.7 |
| United States of America | 9 203 | 9 482 | 3.0 |
| Korea, Republic of (South) | 3 766 | 6 499 | 72.6 |
| Sri Lanka | 2 663 | 5 169 | 94.1 |
| All countries | 210 397 | 294 163 | 39.8 |
|
| Source: Department of Education, Employment and Workplace Relations (DEEWR). Selected Higher Education Statistics. |
Field of study
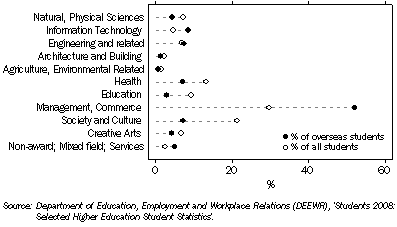
In 2008, across all levels of higher education, the most common fields of study for overseas students were Management and commerce, Information technology, and Engineering and related technologies (graph 12.23), a somewhat different pattern to that for the total population of students - where the most common fields of study were Management and commerce, Society and culture, Health, and Education.
12.23 Proportion of overseas students by field of study, 2008
Level of study
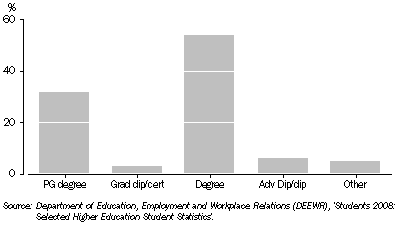
In the higher education sector, overseas student numbers are highest in Bachelor degrees followed by Post-graduate degrees (graph 12.24). There were slightly different patterns in field of study at specific education levels. For example, at the Post-graduate degree level, overseas students primarily studied Management and commerce (55%), Information technology (11%), and Society and culture (9%), while at the Bachelor degree level, overseas students most commonly studied Management and commerce (53%), Health (9.9%), and Engineering and related technologies (8.9%). See table 12.20 for comparable figures relating to all students.
12.24 Proportion of overseas students enrolled by level of education, 2008
Impact on the economy
Overseas higher education students spent a total of $9.5 billion dollars in the 2008-09 financial year. This was comprised of $3.2 billion in fees and $6.3 billion in goods and services. Overall, across all education sectors, fees accounted for $6.3 billion while goods and services accounted for $10.2 billion, adding to a total of $16.5 billion in Australia's international trade in education services (excluding AusAID and Defence, which totalled $0.1 billion).
For more information on export of education services, see
ABS International Trade in Services, 2008-09 (5368.0.55.003) on the ABS website.
 Print Page