|
|
MARCH QTR KEY FIGURES
|
 |
$m
| % change
Dec Qtr 2002 to
Mar Qtr 2003 | % change
Mar Qtr 2002 to
Mar Qtr 2003 |
|
| Merchandise exports | 27,782 | -9.7 | -3.2 |
| Merchandise imports | 31,873 | -10.6 | 11.5 |
|
EXPORTS AND IMPORTS
| BALANCE BY COUNTRY, MARCH 2003
|
MARCH QTR KEY POINTS
BY COUNTRY
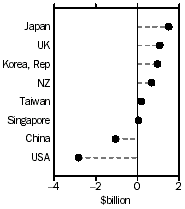
- The surplus with the United Kingdom increased by $898m to $1,062m.
- The deficit with the USA decreased by $457m (14%) to $2,833m.
- The deficit with China decreased by $415m (28%) to $1,062m.
BY COMMODITY
Major Exports
- Passenger vehicles, down $446m (32%) to $947m.
- Beef, down $304m (27%) to $836m.
- Greasy wool, down $281m (34%) to $557m.
- Non-monetary gold, up $276m (22%) to $1,557m.
Major Imports
- Aircraft, down $1,026m (51%) to $994m.
- Toys, games and sporting goods, down $287m (49%) to $294m.
- Telecommunications equipment, down $243m (20%) to $947m.
QUARTERLY ANALYSIS AND COMMENTS
EXCESS OF MERCHANDISE EXPORTS OR IMPORTS
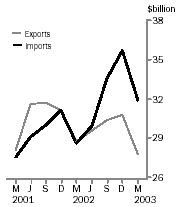
In the March quarter 2003, merchandise imports exceeded merchandise exports by $4,091m, or 15% of the value of exports. This is a decrease of $789m on the deficit recorded in December quarter 2002, which was the largest recorded. Both exports and imports fell during the March quarter, in line with normal seasonal patterns, with the larger reduction in imports leading to the reduced deficit.
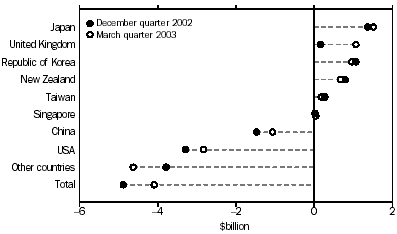
Australia's trade position improved with several of its major trading partners.
Improvements were recorded with:
- United Kingdom, the surplus increased $898m, to $1,062m;
- USA, the deficit decreased $457m (14%), to $2,833m;
- China, the deficit decreased $415m (28%), to $1,062m; and
- Japan, the surplus increased $137m (10%), to $1,504m.
Australia's trade position worsened with:
- New Zealand, the surplus decreased $116m (15%), to $678m;
- Republic of Korea, the surplus decreased $99m (9%), to $960m; and
- Taiwan, the surplus decreased $88m (33%), to $181m.
AUSTRALIA'S QUARTERLY TRADE WITH MAJOR COUNTRIES, Excess of exports (+) or imports (-)
MERCHANDISE EXPORTS
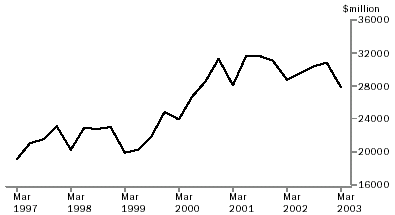
Merchandise exports for the March quarter 2003 were $27,782m, down $2,993m (9.7%) from the December quarter 2002, and down $931m (3.2%) compared with the March quarter 2002.
The decrease in merchandise exports in the quarter was partly the result of a small decrease in average prices received for exports. The Export Price Index fell 0.7% in the March quarter 2003, predominantly driven by appreciation of the Australian dollar against the United States dollar. The main contributors to the decrease were coal and semi-coke, and iron ores and concentrates. These decreases were partially offset by price increases for crude petroleum oils, wool, wheat, gold and nickel. For more information on the Export Price Index, see International Trade Price Indexes, Australia (cat. no. 6457.0).
Estimates of chain volume measures for exports and seasonally adjusted data will be published in the March quarter 2003 issue of Balance of Payments and International Trade Position, Australia (cat. no. 5302.0) to be released on 3 June 2003.
MERCHANDISE EXPORTS
Most export commodity groups recorded decreases during the March quarter 2003. The most significant decreases occurred in:
- Machinery and transport equipment, down $1,022m (26%) to $2,941m, due mainly to large decreases in Passenger vehicles (SITC 781), down $397m (39%) and Aircraft (SITC 792), down $191m (46%).
- Food and live animals, down $906m (18%) to $4,122m, due mainly to decreases in Beef (SITC 011), down $304m (27%), Milk and cream and milk products (SITC 022), down $143m (31%) and Wheat (SITC 041), down $118m (15%).
- Crude materials, inedible, except fuels, down $599m (10%) to $5,164m, due mainly to large decreases in Wool and other animal hair (SITC 268), down $315m (28%), Iron ore (SITC 281), down $112m (8%) and Cotton (SITC 263), down $92m (28%).
- Manufactured goods classified chiefly by material, down $456m (13%) to $2,926m, due mainly a decrease in Nickel (SITC 683), down $193m (47%).
The only commodity group recording a significant increase was Commodities and transactions not classified elsewhere in the SITC, up $698m (22%) to $3,877m, due mainly to an increase in exports of gold.
MERCHANDISE IMPORTS
Merchandise imports for the March quarter 2003 were $31,873m, down $3,781m (10.6%) from the December quarter 2002, but up $3,300m (11.5%) compared with the March quarter 2002.
The decrease in merchandise imports in the quarter was partly the result of a decrease in average prices paid for imports. The Import Price Index fell 1.9% in the March quarter 2003. The main contributors to the price decreases were computing and telecommunications equipment, electrical machinery and road vehicles. These decreases were partially offset by price increases for crude petroleum oils and other petroleum products. For more information on the Import Price Index, see International Trade Price Indexes, Australia (cat. no. 6457.0).
Estimates of chain volume measures for imports and seasonally adjusted data will be published in the March quarter 2003 issue of Balance of Payments and International Trade Position, Australia (cat. no. 5302.0) to be released on 3 June 2003.
MERCHANDISE IMPORTS
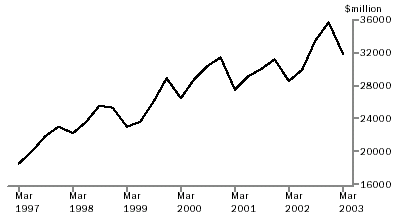
Most import commodity groups recorded decreases during the March quarter 2003. The most significant were:
- Machinery and transport equipment, down $3,016m (18%) to $13,491m, due mainly to decreases in Aircraft (SITC 792), down $1,026m (51%), Telecommunications equipment (SITC 764), down $243m (20%), Heating and cooling equipment (SITC 741), down $198m (37%), Sound and television equipment (SITC 763), down $177m (50%) and Passenger vehicles (SITC 781), down $153m (6%).
- Miscellaneous manufactured articles, down $907m (17%) to $4,304m, due mainly to decreases in Toys, games and sporting goods (SITC 894), down $287m (49%) and Furniture and bedding (SITC 821), down $140m (31%).
- Manufactured goods classified chiefly by material, down $220m (5%) to $3,992m.
The import commodity group that recorded the largest increase was Chemicals and related products, nes, up $333m (9%) to $3,897m, due mainly to increases in Fertilisers (SITC 562), up $182m (164%) and Medicaments (SITC 542), up $85m (9%).
ANNUAL ANALYSIS AND COMMENTS
EXCESS OF MERCHANDISE EXPORTS OR IMPORTS
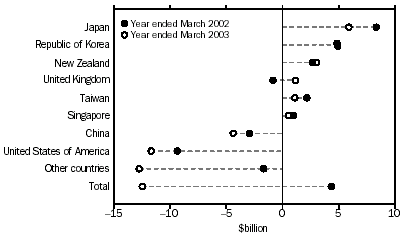
For the year ended March 2003, merchandise imports exceeded merchandise exports by $12,471m, or 11% of the value of exports. This is a $16,793m turnaround from the trade surplus of $4,322m recorded for the year ended March 2002.
Australia's trading position worsened with most of its major trading partners.
- Japan, the surplus decreased by $2,443m (29%) to $5,920m;
- USA, the deficit increased by $2,349m (25%) to $11,699m;
- China, the deficit increased by $1,709m (58%) to $4,632m; and
- Singapore, the surplus decreased by $473m (48%) to $514m.
Australia had an improved trading position with:
- United Kingdom, a turnaround of $2,001m, from a deficit of $847m to a surplus of $1,154m; and
- New Zealand, the surplus increased by $349m (13%) to $3,037m.
AUSTRALIA'S ANNUAL TRADE WITH MAJOR COUNTRIES, Excess of exports (+) or imports (-)
MERCHANDISE EXPORTS
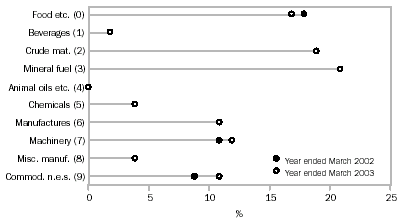
Merchandise exports for the year ended March 2003 were $118,481m, down $4,641m (3.8%) from the year ended March 2002. Most commodity groups recorded decreases with the largest being:
- Food and live animals, down $2,543m (11%) to $19,860m due mainly to decreases in Wheat (SITC 041), down $925m (20%), Vegetables (SITC 054), down $321m (37%), Beef (SITC 011), down $315m (7%), Milk and cream and milk products (SITC 022), down $221m (12%) and Rice (SITC 042), down $200m (62%).
- Crude materials, inedible, except fuels, down $1,229m (5%) to $22,027m due mainly to decreases in Cotton (SITC 263), down $551m (30%), Alumina (SITC 285), down $478m (11%) and Ores and concentrates of base metal (SITC 287), down $323m (20%).
- Mineral Fuels, lubricants and related materials, down $1,152m (4%) to $24,504m due mainly to decreases in Coal (SITC 321), down $1,021m (8%) and Natural gas (SITC 343), down $283m (10%).
- Manufactured goods classified chiefly by material, down $958m (7%) to $12,971m, due mainly to decreases in Aluminium (SITC 684), down $422m (9%) and Copper (SITC 682), down $278m (17%).
Two export commodity groups recorded substantial increases:
- Commodities and transactions n.e.c in the SITC, up $1,510m (13%) to $12,761m; and
- Beverages and tobacco, up $493m (22%) to $2,726m, due mainly to Alcoholic beverages (SITC 112), up $436m (20%) to $2,575m.
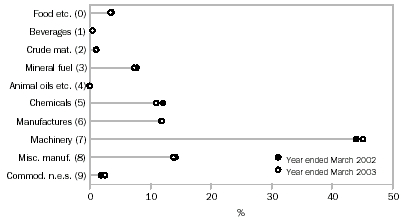
COMMODITY COMPOSITION (SITC SECTION) OF EXPORTS
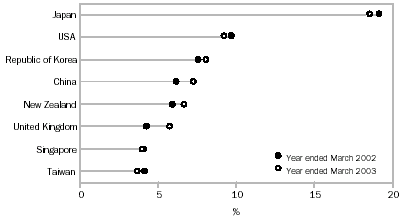
Australia's major export destinations for the year ended March 2003 were:
- Japan, down $1,622m (7%) to $22,092m;
- USA, down $1,075m (9%) to $11,039m;
- Republic of Korea, up $185m (2%) to $9,679m;
- China, up $964m (12%) to $8,709m;
- New Zealand, up $573m (8%) to $8,002m;
- United Kingdom, up $1,542m (29%) to $6,946m;
- Singapore, down $318m (6%) to $4,826m; and
- Taiwan, down $717m (14%) to $4,503m.
COUNTRY COMPOSITION OF EXPORTS
MERCHANDISE IMPORTS
Merchandise imports for the year ended March 2003 were $130,952m, an increase of $12,152m (10.2%) over imports for the year ended March 2002. All import commodity groups recorded increases with the largest being:
- Machinery and transport equipment, up $6,820m (13%) to $59,514m, due mainly to increases in Aircraft (SITC 792), up $2,518m (94%), Passenger vehicles (SITC 781), up $1,156m (13%), Goods vehicles (SITC 782), up $457m (19%) and Ships (SITC 793), up $419m (139%).
- Manufactured goods classified chiefly by material, up $1,519m (11%) to $15,977m, due mainly to increases in Paper and paperboard (SITC 641), up $296m (17%), Manufactures of base metal, nes (SITC 699), up $130m (12%) and Made-up articles of textile materials (SITC 658), up $120m (22%). These increases were partly offset by a decrease in Paper and paperboard, cut to size (SITC 642), down $124m (23%).
- Miscellaneous manufactured articles, up $1,350m (8%) to $18,578m due mainly to increases in Toys, games and sporting goods (SITC 894), up $316m (22%) and Furniture and bedding (SITC 821), up $289m (25%).
COMMODITY COMPOSITION (SITC SECTION) OF IMPORTS
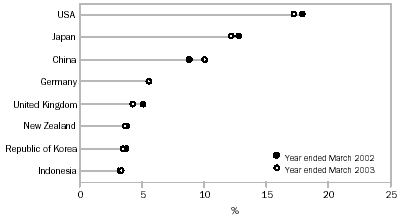
Australia's major import sources for the year ended March 2003 were:
- USA, up $1,274m (6%) to $22,738m;
- Japan, up $822m (5%) to $16,172m;
- China, up $2,673m (25%) to $13,341m;
- Germany, up $679m (10%) to $7,509m;
- United Kingdom, down $459m (7%) to $5,792m;
- New Zealand, up $224m (5%) to $4,965m;
- Republic of Korea, up $244m (5%) to $4,834m; and
- Singapore, up $155m (4%) to $4,312m.
COUNTRY COMPOSITION OF IMPORTS
|
 Print Page
 Print All