This Occasional Paper is intended to make the results of current research available to other interested parties. The aim is to encourage discussion and comment.
Views expressed in this paper are those of the author and do not necessarily represent those of the Australian Bureau of Statistics. Where quoted or used, they should be attributed clearly to the author (Kate Ross).
SUMMARY
INTRODUCTION
The count of Aboriginal and Torres Strait Islander people increased by some 33% between the 1991 and 1996 Censuses. This increase is far greater than can be explained by demographic factors (births, deaths and migration) alone. This paper attempts to explain, as far as is possible, the increase in counts between 1991 and 1996 by considering those factors which are readily quantified, such as births, deaths, migration and changes to census coding procedures. It then considers some characteristics of the Indigenous population in order to find other factors which may have contributed to the increase in counts.
Large intercensal increases in counts such as those recorded between 1991 and 1996 are not a new phenomenon; the Indigenous count recorded in the Census increased 340% in the thirty years to 1996 compared with a 53% increase in the census count for the total population. Such a pattern of increase has been observed in the minority indigenous populations of other developed countries.
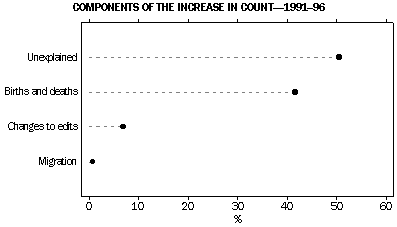
COMPONENTS OF THE INCREASE IN COUNT
The increase in census count between 1991 and 1996 was only partly explainable through this analysis. Factors which contribute to the explainable component of the increase include: births and deaths, census editing procedures and migration. Other factors, less readily quantified but collectively important, are changes between the censuses in undercount, non-response, and/or changes in answers between censuses. Differences in the census Indigenous enumeration strategy could have played a part in these changes. These factors are dealt with in turn.
Births and deaths
Births and deaths of Indigenous people in the inter-censal period have been estimated by the ABS and published in Experimental Projections of the Aboriginal and Torres Strait Islander Population, June 1991-June 2001 (ABS Cat. no 3231.0). Just over 40% of the 1991-96 increase in Indigenous census counts can be attributed to natural increase.
Census editing procedures
During the processing of census data, a series of edits are applied to the data collected in order to remove certain inconsistencies and errors. The Indigenous status variable is edited to change responses of 'Aboriginal' or 'Torres Strait Islander' to 'non-Indigenous' for persons who are unlikely to be Indigenous. For the 1991 and 1996 censuses these edits were based on the birthplaces of the individual and parents. For the 1991 Census there were two edits which changed responses from 'Indigenous' to 'non-Indigenous' when the relevant conditions were met. There was only one, narrower, edit applied for the 1996 Census.
If the 1991 edits had been applied to 1996 Census data, 6,115 Indigenous responses would have been changed to non-Indigenous. This represents about 7% of the increase in the Indigenous count.
Migration
Migration from overseas could contribute to the increase in count for Australia as a whole and movement between states could account for part of the increase at the state level. Data for both geographic levels show that migration does not account for a significant proportion of the increases in Indigenous counts either nationally or across states.
Undercount
Some people are missed each census and some are counted more than once. Considerable effort is made to determine the difference between the true population and the census count; this is referred to as net undercount. The net undercount for the total Australian population was 1.6% in 1996. The methodology used to calculate net undercount can not be reliably applied to the Indigenous population. However, the net undercount for Indigenous people for 1996 has been estimated at just over 7%. Any change in the undercount between 1991 and 1996 may account for a component of the increase in count.
Non-response
In addition to those people who are not enumerated by the census, some people who are enumerated may choose not to answer some or all questions. There have been more people who did not answer the Indigenous status question than who responded positively as 'Indigenous' in all censuses since 1976. Some of the people coded as 'not stated' (non-respondents) will be Indigenous. It is not known what proportion of non-respondents are actually Indigenous. Changes in the rate of non-response will also affect the explainable component of the increase.
Changes in response
The way some people answer the Indigenous status question can change over time and in different situations. People may move between any of the categories of Indigenous status, including between Indigenous and non-Indigenous. Results from the Post-Enumeration Survey, held shortly after the census, showed that 16% of respondents who reported Indigenous origin in the census changed to non-Indigenous in the survey.
Indigenous enumeration strategy
Improvements to the ABS' Indigenous Enumeration Strategy (IES) may underlie these last three factors. A new feature of the IES for 1996 was the employment of a State Indigenous Manager (SIM) in most states and territories to oversee Census arrangements for Indigenous people and promote awareness of the census among Indigenous people and organisations. The promotional work done by the SIMs in each state and territory in encouraging Indigenous people to answer the question affirmatively may have had a large impact on the census count for some states and territories. However, the effectiveness of the strategy is very difficult to measure.
Explainable increase
Combining the effects of births, deaths, census editing and migration, just under half of the increase in the count between 1991 and 1996 can be explained. There are variations by states and territories in the proportion explained; these are discussed in detail in the paper.