|
|
In 1999-2003, the three leading causes of death for Aboriginal and Torres Strait Islander peoples resident in Queensland, South Australia, Western Australia and the Northern Territory were diseases of the circulatory system, external causes of morbidity and mortality (predominantly accidents, intentional self-harm and assault) and neoplasms (cancer). Deaths due to these causes accounted for 58% of all Indigenous deaths (table 9.7) compared with 74% of deaths in the non-Indigenous population.
Standardised mortality ratios (SMRs) have been used in this section to compare death rates between the Indigenous and non-Indigenous populations. The SMR is the ratio between the observed number of deaths in the Indigenous population and the expected number of deaths that would have occurred if the Indigenous population experienced the same age-specific death rates as the non-Indigenous population. If the SMR is greater than 1.0, there were more deaths than expected; if the ratio is less than 1.0, there were fewer deaths than expected.
While the overall undercoverage of the Indigenous deaths in the four jurisdictions used for this analysis will understate SMRs for all causes and for all persons, differential undercoverage by sex, and by cause, will affect detailed analysis of SMRs.
In 1999-2003, for both Indigenous males and females, there were almost three times as many deaths from all causes as would be expected, based on the rates for non-Indigenous Australians. The highest SMRs for Indigenous males and females were for endocrine, nutritional and metabolic diseases, caused mainly by diabetes mellitus. The rates for Indigenous males and females for these diseases were 7 and 11 times, respectively, the rates for non-Indigenous males and females (table 9.7).
9.7 Indigenous deaths, main causes(a) - 1999-2003 |
|  |
 | Males | Females |  |
 | Observed deaths | Expected deaths | SMR(b) | Observed deaths | Expected deaths | SMR(b) |  |
 | no. | no. | rate | no. | no. | rate |  |
|  |
| Diseases of the circulatory system (I00-I99) | 1 134 | 388 | 2.9 | 882 | 347 | 2.5 |  |
| External causes (V01-Y98) | 842 | 306 | 2.7 | 356 | 111 | 3.2 |  |
| Neoplasms (C00-D48) | 592 | 407 | 1.5 | 502 | 345 | 1.5 |  |
| Endocrine, nutritional and metabolic diseases (E00-E90) | 303 | 41 | 7.5 | 372 | 35 | 10.5 |  |
| Diseases of the respiratory system (J00-J99) | 368 | 92 | 4.0 | 269 | 76 | 3.5 |  |
| Diseases of the digestive system (K00-K93) | 208 | 42 | 4.9 | 152 | 36 | 4.3 |  |
| Diseases of the genitourinary system (N00-N99) | 87 | 16 | 5.3 | 139 | 19 | 7.3 |  |
| Symptoms, signs and ill-defined conditions (R00-R99) | 136 | 24 | 5.8 | 88 | 15 | 5.7 |  |
| Certain conditions originating in the perinatal period (P00-P96) | 124 | 43 | 2.9 | 88 | 35 | 2.5 |  |
| Diseases of the nervous system and sense organs (G00-G99) | 111 | 41 | 2.7 | 70 | 41 | 1.7 |  |
| Certain infectious and parasitic diseases (A00-B99) | 97 | 20 | 5.0 | 80 | 14 | 5.8 |  |
| Mental and behavioural disorders (F00-F99) | 122 | 22 | 5.5 | 52 | 24 | 2.2 |  |
| All causes | 4 222 | 1 485 | 2.8 | 3 165 | 1 143 | 2.8 |  |
|  |
| (a) Data for Queensland, South Australia, Western Australia and the Northern Territory combined. Deaths are based on year of occurrence of death for 1999-2002 and year of registration of death for 2003. |
| (b) Standardised mortality rate is the observed Indigenous deaths divided by expected Indigenous deaths, based on the age, sex and cause-specific rates for non-Indigenous Australians. |
| AIHW, National Mortality Database |
Excess deaths
Deaths higher than the expected number are referred to as 'excess deaths'. Excess deaths are calculated by subtracting the number of expected Indigenous deaths based on the age, sex and cause-specific rates of non-Indigenous Australians, from the number of actual deaths in the Indigenous population. Diseases of the circulatory system accounted for the highest proportion of excess deaths. Other major causes of excess deaths were external causes, diseases of the respiratory system and endocrine, nutritional and metabolic diseases. Deaths due to these causes were responsible for around two-thirds of excess deaths among Indigenous males and females (table 9.8).
9.8 Main causes of excess Indigenous deaths(a)(b) - 1999-2003 |
|  |
 | Indigenous males | Indigenous females |  |
 | % | % |  |
|  |
| Diseases of the circulatory system (I00-I99) | 27.3 | 26.5 |  |
| External causes (V01-Y98) | 19.6 | 12.1 |  |
| Endocrine, nutritional and metabolic diseases (E00-E90) | 9.6 | 16.6 |  |
| Diseases of the respiratory system (J00-J99) | 10.1 | 9.5 |  |
| Neoplasms (C00-D48) | 6.8 | 7.8 |  |
| Diseases of the digestive system (K00-K93) | 6.1 | 5.8 |  |
| Diseases of the genitourinary system (N00-N99) | 2.6 | 5.9 |  |
| Symptoms, signs and ill-defined conditions (R00-R99) | 4.1 | 3.6 |  |
| Certain infectious and parasitic diseases (A00-B99) | 2.8 | 3.3 |  |
| Certain conditions originating in the perinatal period (P00-P96) | 3.0 | 2.6 |  |
| Mental and behavioural disorders (F00-F99) | 3.6 | 1.4 |  |
| All other causes | 4.5 | 4.9 |  |
| All causes | 100.0 | 100.0 |  |
|  |
| (a) Data for Queensland, South Australia, Western Australia and the Northern Territory combined. Deaths are based on year of occurrence of death for 1999-2002 and year of registration of death for 2003. |
| (b) Excess deaths are equal to the observed Indigenous deaths minus expected Indigenous deaths (based on the 1999-2003 age, sex and cause specific rates for non-Indigenous Australians). |
| AIHW, National Mortality Database |
Main causes of Indigenous deaths
The following disease-specific analysis highlights the different patterns of mortality experienced by the Indigenous and non-Indigenous populations. The proportion of deaths due to any one disease or disease group is affected by the overall pattern of deaths within a given population. Therefore it is important to analyse the overall pattern of deaths when interpreting comparisons that are made of proportions due to one cause or a group of causes of deaths.
The diseases covered below, which include circulatory system diseases, diabetes, chronic kidney diseases, injuries, neoplasms and respiratory diseases, accounted for 77% and 86% of all deaths among Indigenous and non-Indigenous Australians respectively (table 9.9).
9.9 Main causes of deaths(a), by Indigenous status - 1999-2003 |
|  |
 | Number of deaths (no.) | Proportion of total deaths (%) |  |
 | Indigenous | Non-Indigenous | Indigenous | Non-Indigenous |  |
|  |
| Diseases of the circulatory system | 2 016 | 85 339 | 27.3 | 38.2 |  |
| External causes of mortality | 1 198 | 14 480 | 16.2 | 6.5 |  |
| Neoplasms | 1 094 | 65 354 | 14.8 | 29.3 |  |
| Respiratory diseases | 637 | 19 011 | 8.6 | 8.5 |  |
| Diabetes | 603 | 5 012 | 8.2 | 2.2 |  |
| Chronic kidney disease | 277 | 3 729 | 3.7 | 1.7 |  |
| Subtotal(b) | 5 707 | 192 044 | 77.3 | 86.0 |  |
| Total | 7 387 | 223 384 | 100.0 | 100.0 |  |
|  |
| (a) Data for Queensland, South Australia, Western Australia and the Northern Territory combined. Deaths are based on year of occurrence of death for 1999-2002 and year of registration of death for 2003. Disease groupings are based on ICD-10 chapter. |
| (b) Subtotal does not equal the sum of the separate diseases as chronic kidney disease overlaps other categories such as diseases of the circulatory system and diabetes. |
| AIHW National Mortality Database |
Circulatory diseases
Diseases of the circulatory system were responsible for 27% and 28% of total Indigenous male and female deaths, respectively, for the period 1999-2003. These rates were less than for non-Indigenous Australians, where these diseases accounted for 35% of male deaths and 41% of female deaths. Within circulatory system diseases, ischaemic heart diseases (heart attack, angina) were responsible for 63% of Indigenous male deaths and 50% of Indigenous female deaths, while cerebrovascular disease (stroke) accounted for 15% of male deaths and 20% of female deaths.
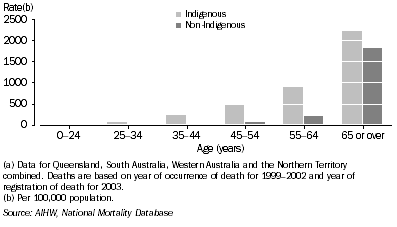
Compared to non-Indigenous Australians, Indigenous males and females experienced higher rates of mortality from diseases of the circulatory system in every age group. The greatest differences in age-specific death rates for males occurred in the age groups 25-34 and 35-44 years, with Indigenous males recording a rate 9 to 10 times the rate for non-Indigenous males. Indigenous females recorded rates 12 to 13 times the rates for non-Indigenous females for the 35-44 and 45-54 year age groups (graphs 9.10 and 9.11).
9.10 Male death rates, circulatory diseases, by Indigenous status and age - 1999-2003(a)
 9.11 Female death rates, circulatory diseases, by Indigenous status - 1999-2003(a)

Diabetes
The major cause of Indigenous deaths within the endocrine disease category is diabetes. Diabetes has a far greater impact on mortality for the Indigenous population than for the non-Indigenous population. For the period 1999-2003, diabetes was responsible for 8% of total Indigenous deaths compared with 2% of non-Indigenous deaths. For non-Indigenous Australians, the proportion of total deaths caused by diabetes was around 2% for all age groups from 45-54 years and over. For Indigenous Australians, diabetes was responsible for 10% of deaths in the 45-54 years age group and for 15% of total Indigenous deaths in the 55-64 year age group (graph 9.12).
9.12 Diabetes deaths as a proportion of total deaths, by Indigenous status and age - 1999-2003(a)

The earlier onset of diabetes experienced by the Indigenous population is reflected in the differences in age-specific death rates. For the period 1999-2003, Indigenous males in the 35-44 and 45-54 years age groups experienced age-specific death rates 23 and 25 times, respectively, the corresponding rates for non-Indigenous males (graph 9.13). For the same age groups, the rates experienced by Indigenous females were 37 and 43 times the corresponding non-Indigenous female rates (graph 9.14). The markedly higher death rates from diabetes in the Indigenous population are partly a reflection of the earlier onset of diabetes in the Indigenous population compared to the non-Indigenous population, combined with a high prevalence of some of the risk factors associated with diabetes such as smoking, hypertension and obesity. Higher death rates from diabetes may also reflect poorer management of diabetes among Indigenous people, particularly those living in rural and remote areas (Wood & Patterson 1999).
9.13 Male death rates, diabetes, by Indigenous status and age - 1999-2003(a)
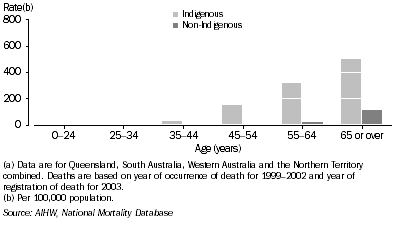 9.14 Female death rates, diabetes, by Indigenous status and age - 1999-2003(a)

Chronic kidney disease
Chronic kidney disease was responsible for 3% and 5% of Indigenous male and female deaths, respectively, for the period 1999-2003. The overall death rates from chronic kidney disease were 7 and 10 times as high as the rates for non-Indigenous males and females. Among Indigenous deaths from chronic kidney diseases, chronic renal failure accounted for 43% of male deaths and 40% of female deaths, while diabetic nephropathy accounted for 23% (males) and 29% (females) respectively.
Both Indigenous males and females experienced markedly higher rates of mortality from chronic kidney disease after the age of 25 years. The greatest differences in age-specific death rates for males occurred in the 25-34 and 45-54 years age groups with Indigenous males recording rates 38 and 31 times the rates for non-Indigenous males (graph 9.15). Indigenous females recorded rates 57 and 48 times the rates for non-Indigenous females in the 45-54 and 55-64 years age groups (graph 9.16).
9.15 Male death rates, chronic kidney disease, by Indigenous status and age - 1999-2003(a)
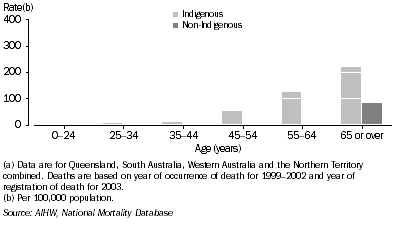 9.16 Female death rates, chronic kidney disease, by Indigenous status and age - 1999-2003(a)

External causes of mortality
For the period 1999-2003, deaths due to external causes, such as accidents, intentional self-harm (suicide) and assault accounted for 16% of all Indigenous deaths, compared with 6% of all deaths among non-Indigenous Australians. For both populations, males accounted for around 70% of the total deaths due to external causes. For Indigenous males, the leading causes of death from external causes were intentional self-harm (34%), transport accidents (27%) and assault (11%), while for Indigenous females the leading causes were transport accidents (31%), assault (19%) and intentional self-harm (17%).
Over the period 1999-2003, for most age groups the age-specific death rates for Indigenous males were two to three times the corresponding rates for non-Indigenous males (graph 9.17). Indigenous females experienced higher age-specific death rates than non-Indigenous females in every age group, with the greatest difference occurring in the 35-44 year age group. In this age group, Indigenous females recorded a rate almost four times that of non-Indigenous females (graph 9.18).
9.17 Male death rates, external causes of morbidity and mortality, by Indigenous status and age - 1999-2003(a)
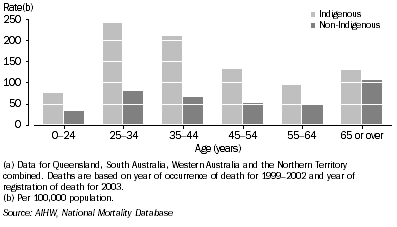 9.18 Female death rates, external causes of morbidity and mortality, by Indigenous status and age - 1999-2003(a)

Intentional self-harm (including suicide)
Intentional self-harm was the leading external cause of death for Indigenous males for the 1999-2003 period. The suicide rate was more than twice that for non-Indigenous males, with the major differences occurring in younger age groups. For Indigenous males aged 0-24 years and 25-34 years, the age-specific rates were three times the corresponding age-specific rates for non-Indigenous males (graph 9.19).
The suicide rate for Indigenous females aged 0-24 years was five times the corresponding age-specific rate for non-Indigenous females. For age groups 35-44 and over, age-specific rates for Indigenous females were similar to, or lower than, the corresponding rates for non-Indigenous females (graph 9.20).
9.19 Male death rates, intentional self-harm, by Indigenous status and age - 1999-2003(a)
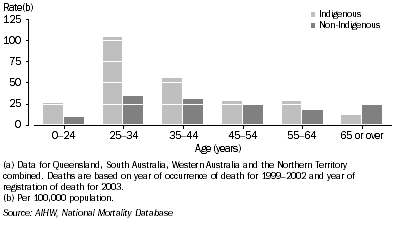 9.20 Female death rates, intentional self-harm, by Indigenous status and age - 1999-2003(a)

Assault
Assault is a significant cause of death for both Indigenous males and females. Over the period 1999-2003, the Indigenous male age-specific death rates for ten-year age groups from 25 to 54 were between 10 and 18 times the corresponding age-specific rates for non-Indigenous males, while for females the rates ranged between 6 and 16 times the equivalent age-specific rates for non-Indigenous females (graphs 9.21 and 9.22).
9.21 Male death rates, assault, by Indigenous status and age - 1999-2003(a)
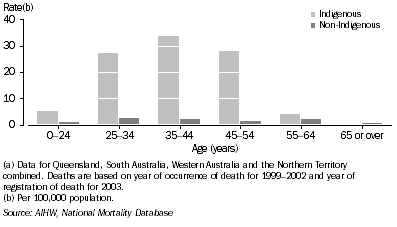 9.22 Female death rates, assault, by Indigenous status and age - 1999-2003(a)

Neoplasms (cancers)
Neoplasms were responsible for 15% of total Indigenous deaths compared with 29% of total non-Indigenous deaths for the period 1999-2003. Indigenous people are over-represented in deaths from cancer compared with non-Indigenous Australians (the SMR for both males and females is 1.5), and more markedly so for some types of cancer. This apparent contradiction is due to very high death rates from other causes rather than low death rates from cancer. The major causes of cancer deaths for Indigenous males were malignant neoplasms of the respiratory and intrathoracic organs (32% of total), malignant neoplasms of the digestive organs (29%), and malignant neoplasms of lip, oral cavity and pharynx (7%). For Indigenous females the major causes were malignant neoplasms of the respiratory and intrathoracic organs (21% of total), malignant neoplasms of the digestive organs (19%), and malignant neoplasms of the female genital organs (16%).
Indigenous persons were over-represented in a number of cancer groups, including malignant neoplasms of lip, oral cavity and pharynx (6% of total Indigenous cancer deaths compared with 2% of non-Indigenous cancer deaths), malignant neoplasms of the respiratory and intrathoracic organs (27% Indigenous; 20% non-Indigenous) and malignant neoplasms of female genital organs (16% total Indigenous females; 9% non-Indigenous females).
Indigenous persons were under-represented in other cancer groups, including melanoma and other malignant neoplasms of skin (1% of total Indigenous cancer deaths compared with 4% of non-Indigenous cancer deaths), and malignant neoplasms of male genital organs (6% total Indigenous males, 13% non-Indigenous males).
The 1999-2003 age-specific death rates for neoplasms indicate that for age groups up to 25-34 years the rates for Indigenous males and females were closer to those for non-Indigenous males and females than for the older age groups 35-44, 45-54 and 55-64 years, where the rates for Indigenous males and females were up to twice the non-Indigenous rates (graphs 9.23 and 9.24).
9.23 Male death rates, neoplasms, by Indigenous status and age - 1999-2003(a)
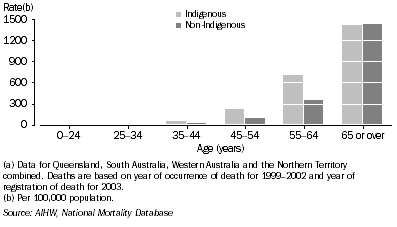 9.24 Female death rates, neoplasms, by Indigenous status and age - 1999-2003(a)

Cancer mortality of the Northern Territory Indigenous population has been compared with that of the Australian population for 1977-2000 (Condon et al. 2004). The cancer mortality rate among Indigenous people was higher than the total Australian rate for cancers of the liver, lungs, uterus, cervix and thyroid, and, in younger people only, for cancers of the oropharynx, oesophagus and pancreas. Northern Territory cancer mortality rates for Indigenous Australians were lower than the total Australian rates for renal cancers and melanoma, and, in older people only, for cancers of the prostate and bowel. Over the period 1977-2000, there were increases in death rates for cancers of the oropharynx, pancreas and lung; all three are smoking-related cancers.
Respiratory diseases
Respiratory diseases, which include influenza, pneumonia and chronic lower respiratory diseases (including asthma, bronchitis and emphysema), were responsible for 9% of total Indigenous deaths for the period 1999-2003. Like diabetes, respiratory diseases affect the Indigenous population at younger ages than is the case for the non-Indigenous population, and this is reflected in the differences in age-specific death rates from these diseases. For the period 1999-2003, Indigenous males in the 35-44 year age group experienced age-specific death rates almost 18 times higher than the corresponding rate for non-Indigenous males, while the rate for Indigenous females in this age group was 14 times higher than the corresponding rate for non-Indigenous females (graphs 9.25 and 9.26).
9.25 Male death rates, respiratory diseases, by Indigenous status and age - 1999-2003(a)
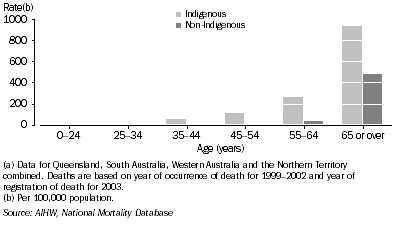 9.26 Female death rates, respiratory diseases, by Indigenous status and age - 1999-2003(a)

Multiple causes of death
Multiple causes of death include all causes and conditions reported on the death certificate. Since 1997, the ABS has coded all causes of death reported on each death certificate, including the underlying, immediate and other associated causes of death. While only one cause can be recorded as the underlying cause of death, many deaths due to chronic diseases, such as heart disease, kidney disease and diabetes, often occur with concurrent, or co-existing, conditions. It is useful, therefore, to describe the extent to which any or all of these conditions have been reported. For deaths where the underlying cause was identified as an external cause, multiple causes include the circumstances of injury and the nature of injury, as well as any other conditions reported on the death certificate.
For the 7,387 Indigenous deaths in 1999-2003 in Queensland, South Australia, Western Australia and the Northern Territory, there were a total of 22,747 causes reported, an average of three causes per death. Deaths where only a single cause was reported occurred in 16% of total Indigenous male deaths and 15% of total Indigenous female deaths, less than for non-Indigenous males (23%) and females (24%) (table 9.27). Deaths where multiple causes were reported were more common among Indigenous people. For example, 19% of deaths among Indigenous males and 21% of deaths among Indigenous females recorded five or more causes of death, compared with 14% and 13% of non-Indigenous male and female deaths respectively.
9.27 Deaths by number of causes reported(a), by Indigenous status - 1999-2003 |
|  |
 | Number of deaths | Proportion of deaths(b) |  |
 | Males | Females | Males | Females |  |
| Number of causes | no. | no. | % | % |  |
Indigenous |  |
|  |
| One | 695 | 508 | 16.3 | 14.8 |  |
| Two | 1 265 | 785 | 25.9 | 23.7 |  |
| Three | 958 | 685 | 24.4 | 23.5 |  |
| Four | 577 | 544 | 15.5 | 18.5 |  |
| Five or more | 727 | 643 | 19.3 | 21.4 |  |
| Total(c) | 4 222 | 3 165 | 100.0 | 100.0 |  |
Non-Indigenous |  |
|  |
| One | 26 632 | 25 708 | 22.6 | 24.3 |  |
| Two | 32 585 | 28 397 | 27.7 | 26.9 |  |
| Three | 26 220 | 23 607 | 22.3 | 22.4 |  |
| Four | 16 236 | 14 321 | 13.8 | 13.6 |  |
| Five or more | 16 095 | 13 577 | 13.7 | 12.9 |  |
| Total(c) | 117 774 | 105 610 | 100.0 | 100.0 |  |
|  |
| (a) Data for Queensland, South Australia, Western Australia and the Northern Territory combined. Deaths are based on year of occurrence of death for 1999-2002 and year of registration of death for 2003. |
| (b) Proportions have been indirectly age standardised using the age-and-sex-specific rates for non-Indigenous Australians. Components may not add to total when indirect age standardisation is used. |
| (c) Includes deaths for which no cause of death was recorded. |
| AIHW, National Mortality Database. |
Table 9.28 shows the relationships between a number of underlying causes of death and associated causes for Indigenous and non-Indigenous Australians. For deaths from ischaemic heart disease, diabetes was reported as an associated cause of death among Indigenous males and females at two to three times the rates of non-Indigenous males and females. For deaths from diabetes, renal failure was reported as an associated cause of death among Indigenous males and females at almost twice the rates of non-Indigenous males and females.
9.28 Underlying causes of death(a), by selected associated causes - 1999-2003 |
|  |
 |  |  | Indigenous(b)(c) | Non-Indigenous(b)(c) |  |
 |  |  | Males | Females | Males | Females |  |
 |  |  | % | % | % | % |  |
|  |
| Neoplasms (C00-D48) |  |  |  |  |  |
 | Reported alone | 30.0 | 27.8 | 40.0 | 44.0 |  |
 | Reported with: |  |  |  |  |  |
 |  | Septicaemia | 4.4 | 5.8 | 3.5 | 3.3 |  |
 |  | Diabetes mellitus | 9.5 | 14.6 | 4.3 | 3.6 |  |
 |  | Ischaemic heart disease | 5.8 | 9.3 | 8.1 | 5.4 |  |
 |  | Cerebrovascular diseases | 3.1 | 3.3 | 3.5 | 3.5 |  |
 |  | Influenza and pneumonia | 11.5 | 8.2 | 8.2 | 6.2 |  |
 |  | Renal failure | 6.8 | 9.2 | 5.6 | 4.2 |  |
 |  | Chronic lower respiratory diseases | 11.0 | 8.7 | 7.1 | 4.0 |  |
| Diabetes mellitus (E10-E14) |  |  |  |  |  |
 | Reported alone | 0.4 | 0.8 | 1.7 | 1.4 |  |
 | Reported with: |  |  |  |  |  |
 |  | Septicaemia | 13.9 | 12.8 | 7.4 | 8.1 |  |
 |  | Ischaemic heart disease | 50.8 | 43.6 | 58.3 | 50.5 |  |
 |  | Cerebrovascular diseases | 14.3 | 17.9 | 20.7 | 24.1 |  |
 |  | Influenza and pneumonia | 7.1 | 9.3 | 9.8 | 7.7 |  |
 |  | Renal failure | 39.8 | 42.1 | 22.8 | 23.2 |  |
 |  | Chronic lower respiratory diseases | 6.0 | 5.5 | 7.1 | 5.0 |  |
| Ischaemic heart disease (I20-I25) |  |  |  |  |  |
 | Reported alone | 19.5 | 13.2 | 15.8 | 14.0 |  |
 | Reported with: |  |  |  |  |  |
 |  | Diabetes mellitus | 17.0 | 25.7 | 9.9 | 8.9 |  |
 |  | Cerebrovascular diseases | 3.9 | 9.3 | 7.3 | 9.7 |  |
 |  | Influenza and pneumonia | 4.1 | 4.2 | 4.6 | 5.1 |  |
 |  | Renal failure | 7.3 | 17.7 | 9.9 | 9.1 |  |
 |  | Chronic lower respiratory diseases | 9.8 | 12.6 | 11.5 | 7.5 |  |
 |  | Neoplasms | 3.0 | 4.4 | 7.5 | 4.6 |  |
| Renal failure (N17-N19) |  |  |  |  |  |
 | Reported alone | 7.8 | 12.3 | 7.4 | 11.0 |  |
 | Reported with: |  |  |  |  |  |
 |  | Septicaemia | 23.5 | 19.2 | 10.1 | 8.3 |  |
 |  | Diabetes mellitus | 19.6 | 12.6 | 7.1 | 6.7 |  |
 |  | Ischaemic heart disease | 31.4 | 15.5 | 30.7 | 23.8 |  |
 |  | Cerebrovascular diseases | 5.9 | 5.6 | 6.8 | 6.6 |  |
 |  | Influenza and pneumonia | 11.8 | 12.9 | 13.0 | 12.4 |  |
 |  | Chronic lower respiratory diseases | 3.9 | 9.4 | 8.0 | 4.3 |  |
|  |
| (a) Data are for Queensland, South Australia, Western Australia and the Northern Territory combined. Deaths based on year of occurrence of death for 1999-2002 and year of registration of death for 2003. |
| (b) Proportions have been indirectly age standardised using the age, sex and cause-specific proportions of non-Indigenous Australians. |
| (c) Sum of components may exceed 100% as more than one associated cause can be recorded for each death. |
| AIHW, National Mortality Database |
Table 9.29 uses the recording of multiple causes of death to align the type and extent of injuries sustained by Indigenous people whose deaths were due to external causes. For the period 1999-2003, of all deaths from transport accidents, 40% involved injuries to multiple body parts, 36% involved injuries to the head and 20% involved injuries to the chest. For deaths from accidents other than transport accidents, 39% were for 'other and unspecified effect', while injuries to the head and poisoning were each involved in 16% of the deaths from these accidents. Most deaths from intentional self-harm were for 'other and unspecified effects' (82%), while deaths from assault most commonly involved injuries to the head (33%) or chest (31%).
9.29 Deaths due to external causes by nature of injury(a), Indigenous Australians - 1999-2003 |
|  |
| Nature of injury | Transport accidents (V01-V99) | Other accidents (W00-X59) | Intentional self-harm (X60-X84) | Assault (X85-Y09) | Total (V01-Y98) |  |
|  |
| Injuries to the head (S00-S09) | % | 36.2 | 16.3 | 4.0 | 33.1 | 20.0 |  |
| Injuries to the neck (S10-S19) | % | 7.7 | 3.8 | 9.2 | 10.0 | 7.2 |  |
| Injuries to the thorax (chest) (S20-S29) | % | 20.2 | 1.9 | 1.4 | 31.3 | 11.0 |  |
| Injuries to the abdomen, lower back, lumbar spine, pelvis, hip and thigh (S30-S39, S70-S79) | % | 11.0 | 8.0 | 2.0 | 17.5 | 8.1 |  |
| Injuries involving multiple body parts (T00-T07) | % | 40.4 | 1.0 | 1.2 | 9.4 | 13.4 |  |
| Injuries to unspecified part of trunk, limb or body region (T08-T14) | % | 7.4 | 2.2 | 0.3 | 11.3 | 4.3 |  |
| Effects of foreign body entering through natural orifice (T15-T19) | % | 1.2 | 7.7 | 0.3 | 1.3 | 2.7 |  |
| Burns and corrosions (T20-T32) | % | 0.6 | 5.8 | 0.6 | - | 1.8 |  |
| Poisoning by drugs, medicaments and biological substances (T36-T50) | % | - | 16.3 | 3.8 | - | 5.6 |  |
| Toxic effects of substances chiefly non-medicinal as to source (T51-T65) | % | 3.9 | 14.1 | 8.4 | 4.4 | 7.8 |  |
| Other and unspecified effects of external causes (T66-T78) | % | 3.6 | 39.3 | 82.1 | 3.8 | 36.0 |  |
| Other | % | 4.5 | 6.4 | 1.4 | 8.1 | 6.5 |  |
| Total deaths (V01-Y98)(b) | no. | 337 | 313 | 346 | 160 | 1 198 |  |
|  |
| - nil or rounded to zero (including null cells) |
| (a) Data for Queensland, South Australia, Western Australia and the Northern Territory combined. Deaths are based on year of occurrence of death for 1999-2002 and year of registration of death for 2003. |
| (b) Sum of components may exceed 100% as more than one injury can be recorded for each death. |
| AIHW, National Mortality Database |
|
 Print Page
 Print All