MOBILITY PATTERNS
Mobility patterns of Indigenous and non-Indigenous people as seen in Census data were quite similar. Approximately 57% of Indigenous people reported living at the same address as in 2001, compared with 60% of non-Indigenous people. Of those who were living at a different address in 2006 (and living in Australia), about half of both Indigenous (51%) and non-Indigenous (56%) people had moved between Statistical Local Areas (SLAs) within the same state or territory. Indigenous people were slightly more likely than non-Indigenous people to have remained within the same SLA (34% compared with 30%), and almost equally as likely to have moved interstate (14% for Indigenous people, 13% for non-Indigenous people).
MOBILITY BETWEEN 2001 AND 2006(a)

Indigenous mobility between Remoteness Areas
Between 2001 and 2006, 12% of Indigenous people aged 5 years and over in 2006 moved between Remoteness Areas. Major Cities, Inner Regional areas and Outer Regional areas all attracted similar numbers of Indigenous people (between 10,500 and 11,300) into them; and were also the greatest sources of migrants to other areas (approximately 10,000).
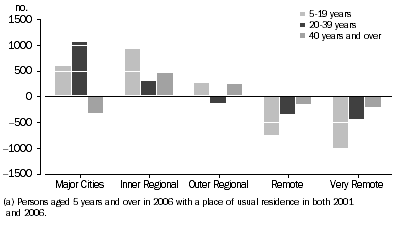
An overall pattern of migration from more remote areas to less remote areas was observed between 2001 and 2006, with Very Remote areas having the greatest net loss of Indigenous people (-1,700) and Major Cities having the greatest net gain (1,300). This resulted in a net increase for the Indigenous population in Major Cities of 1%, and a net decrease of 3% in Very Remote areas.
INDIGENOUS MOVEMENT IN AND OUT OF REMOTENESS AREAS(a)(b), 2001 to 2006

There were different rates and patterns of mobility observed for different age groups. Indigenous people aged 5-19 years accounted for 43% of net movement between Remoteness Areas, and were most likely to leave Remote and Very Remote areas, accounting for 45% and 57% of the movement out of these areas. Indigenous people aged 40 years and over were least likely to change address, with 70% of this age group living at the same address as 2001.
Indigenous people aged 5-19 years were most likely to move to Inner Regional areas. One of the contributors for younger people moving away from Remote and Very Remote areas is to attend school. Of Indigenous people aged 5-19 years who moved away from Remote and Very Remote areas to Inner Regional areas, 8% were enumerated at a boarding school or residential college/halls of residence. Indigenous people aged 20-39 years were most likely to move to Major Cities. Unlike the younger age groups, Indigenous people aged 40 years and over had a net migration away from Major Cities, as well as Remote and Very Remote areas, into Inner Regional and Outer Regional areas.
NET EFFECT OF INDIGENOUS MOBILITY 2001 and 2006(a), Remoteness Areas by Age

 Print Page
 Print All