The ABS will be closed from 12.00pm, 24 December 2025 and will reopen at 9.00am, 2 January 2026. During this time there will be no statistical releases and our support functions will be unavailable. The ABS wishes you a safe and happy Christmas.

Australian National Accounts: Finance and Wealth

Latest release

National, public and private corporations, government and household financial and capital accounts, and household balance sheets.

Reference period
September 2025
Released
18/12/2025
  • Next Release 26/03/2026
    Australian National Accounts: Finance and Wealth, December 2025
  • Next Release 25/06/2026
    Australian National Accounts: Finance and Wealth, March 2026
  • Next Release 24/09/2026
    Australian National Accounts: Finance and Wealth, June 2026
  • View all releases
Release date and time
18/12/2025 11:30am AEDT

Key statistics

  • Household wealth increased $551.3b (3.1%) to $18,400.7b.
  • Demand for credit was $155.6b.
  • Australia's net borrowing position rose by $14.0b to $31.2b this quarter.
  • Capital investment as a proportion of GDP increased to 24.5%.

Main features

Financing resources and investment tables

Financial market summary table

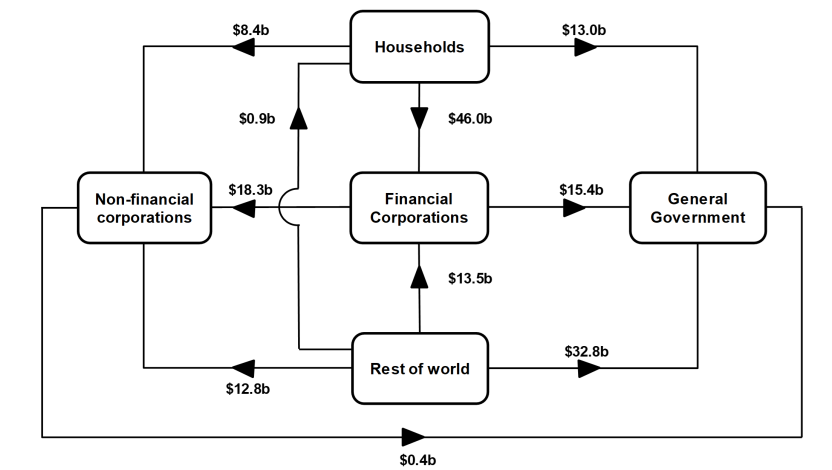
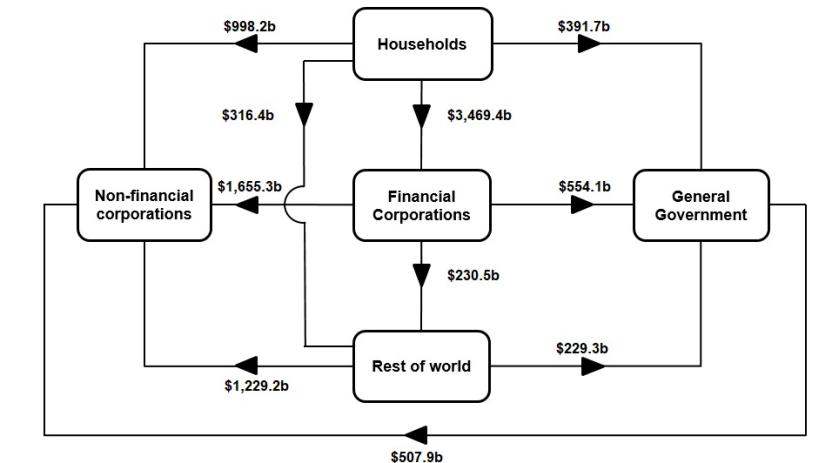
Flow of funds diagrams

National investment

National investment decreased by $7.0b to $171.9b in the September quarter.

  • General government investment decreased by $8.7b to $24.9b, driven by a decrease in gross fixed capital formation for both state and local general government and national general government.
  • Non-financial corporations' investment decreased by $0.8b to $85.4b, driven by a decrease in gross fixed capital formation for both private and public non-financial corporations.
  • Households' investment increased by $2.5b to $57.4b, driven by an increase in gross fixed capital formation.

Financial investment

Australia was a net borrower of $31.2b from rest of world (ROW). The main contributors were a:

  • $63.7b acquisition by ROW of debt securities issued by Australia
  • $31.1b acquisition by ROW of equity issued by Australia
  • Partly offset by $28.3b disposal by ROW of equity issued by Australia

Australia recorded is largest net borrowing position in the September quarter, which reflected strong ROW investment in Australian company shares, and debt securities issued by the government and banks.
 

Households

Households' $67.5b net lending position was due to a $97.6b acquisition of financial assets, partly offset by a $30.1b incurrence of liabilities. The acquisition of assets was driven by:

  • $63.3b in deposits
  • $28.6b net equity in superannuation 

While liabilities were driven by:

  • $30.3b in loan borrowings

Household deposits grew strongly in September, largely due to the seasonal timing of tax refunds.

General government

General government’s $54.4b net borrowing position was due to a $69.2b incurrence of liabilities, partly offset by a $14.8b acquisition of financial assets. The acquisition of assets was driven by a:

  • $12.7b increase in other accounts
  • $9.8b increase in deposits
  • Partly offset by a $8.5b reduction in loan assets

Liabilities were driven by:

  • $46.0b net bond issuance
  • $23.2b in loan borrowings

The national general government remained in a net borrowing position for a fifth consecutive quarter. Net issuance of Treasury bonds this quarter was driven by ongoing funding requirements. State and territory governments continued to borrow funds from their respective central borrowing authorities to fund infrastructure projects.

Demand for credit

Demand for credit table

Demand for credit was $155.6b in the September quarter, of which:

  • General government borrowed $63.4b
  • Private non-financial businesses borrowed $55.1b.
  • Households borrowed $30.1b

Credit market outstandings increased by $286b, comprised of demand for credit of $142.8b and revaluation gains of $143.2b. Other Private Non-Financial Corporations and National General Government drove the rise in demand for credit whilst Other Private Non-Financial Corporations drove the revaluation gains.

Other private non-financial corporations

Growth in business credit was driven by loans from authorised deposit-taking institutions (ADIs) this quarter alongside increased equity investment in Australian companies by the ROW. Business financing activity comprised:

  • equity raising of $29.5b
  • loan borrowings of $25.9b

General government

Commonweallth government demand for credit was driven by increased issuance of new debt securities. State and local general government demand for credit was driven by increased loans from central borrowing authorities.
General government financing activity comprised:

  • $39.1b in net issuance of bonds and one name paper by national general government
  • $23.6b in loan borrowings by state and local general government

Households

Housing credit growth in September quarter was driven by increased investor lending. Growth in household loan liabilities were partly offset by the government's write down of student debt. Households borrowed:

  • $30.3b in long term loans
  • Partly offset by a net repayment of $0.1b in short term loans
  1. "Other" includes private non-financial investment funds and public non-financial corporations.

Households

Balance sheet

Financial assets

Liabilities

Household wealth grew by 3.1% ($551.3b) to $18,400.7b by the end of the September quarter. The increase in net worth was driven by growth in the value of land and dwellings, and financial assets.
 

Non-financial assets

Non-financial assets owned by households increased by 2.4% ($309.1b). The value of residential land and dwellings increased by 2.7% ($303.7b), with property prices and the number of dwellings both rising during the quarter.

Financial assets

Financial assets of households increased by 3.2% ($270.8b), with a:

  • $160.2b rise in superannuation reserves
  • $63.0b rise in deposits
  • $38.3b rise in shares and equity

The rise in the value of superannuation reserves and shares and other equity was due to continued strong performance in both domestic and overseas share markets. The final increase to the super guarantee occurred in the September quarter, further adding to superannuation balances.

Total deposits increased by 3.5% ($63.0b). Transferable deposit account balances rose $52.7b and non transaction deposit accounts (which include term deposit and other savings accounts) rose $10.0b.
 

Liabilities

Household liabilities increased by 0.9% ($28.6b), with a:

  • $28.8b rise in long-term loans.

This was slightly offset by a:

  • $0.1b fall in short-term loans.

The growth in long-term loans was driven by a 1.9% ($47.8b) rise in housing loans, with both investors and owner occupiers contributing to demand. This was partly offset by a fall in loans from National General Government, as legislation was passed this quarter to reduce student debt by 20 per cent.

Private non-financial corporations

Financial assets

Liabilities

The debt-to-equity ratio (adjusted for price changes) increased to 0.58 and follows the gradual increase in the ratio seen since the September quarter 2021. The unadjusted debt-to-equity ratio fell to 0.44 in the September quarter 2025 following strong domestic equity market performance.

Other private non-financial corporations demand for credit

Other private non-financial corporations demand for credit of $55.1b was driven by:

  • $25.9b of loan borrowings
  • $29.5b of equity raising

Financial corporations

Financial assets and liabilities

Authorised deposit-taking institutions (ADIs)

Financial assets

Liabilities

Total financial assets of ADIs increased $46.7b, with a:

  • $94.2b increase in loans

This was partly offset by a:

  • $18.4b decrease in deposits,
  • $7.5b decrease in bonds

Growth in ADI lending activity continued to be driven by loans to households and businesses. ADIs decreased their deposits with the rest of the world as well as their exchange settlement account balances with the Reserve Bank of Australia (RBA). ADIs also reduced their holdings of bonds, particularly those issued by securitisers. 

Liabilities of ADIs increased $73.6b, with a:

  • $75.1b increase in deposits
  • $9.7b increase in shares and equities

Growth in ADI deposits was primarily driven by households and private non-financial corporations. Continued strong performance of the domestic share market over the quarter led to a rise in equity values of listed ADIs.

Pension (superannuation) funds

Financial assets

Liabilities

Total financial assets of pension (superannuation funds) increased by 4.2% ($155.8b), with a:

  • $151.1b increase in shares and equity
  • $4.2b increase in deposits
  • $3.3b increase in bonds

Strength in shares and equity was driven by revaluations reflecting growth in domestic and international share markets. Pension funds also used households' contributions to superannuation to acquire $14.2b of equity issued by non-money market investment funds and $8.8b of equity issued by non-residents.

Government

National general government financial assets

National general government liabilities

State and local general government financial assets

State and local general government liabilities

General government

General government (national, and state) were net borrowers of $54.4b. This was driven by a:

  • $45.6b net issuance of bond liabilities
  • $31.7b net borrowing of loans

Partly offset by:

  • $9.8b placed in deposits
  • $8.7b net maturity of one name paper liabilities

National general government were net borrowers of $36.8b. This was driven by a:

  • $44.8b net issuance of bond liabilities

Partly offset by:

  • $8.7b net maturity of one name paper liabilities

The September quarter saw the highest demand for credit by the Commonwealth government since the September quarter 2020. This was mainly driven by the issuance of new debt securities, and follows a large repayment of debt last quarter.


State and local general government were net borrowers of $17.7b. The state and local general government's net borrowing position was mainly driven by:

  • $22.2b net borrowing of loans

Partly offset by:

  • $7.5b placed in deposits

Loan liabilities of state and local general government reached record levels of $498.9b as state governments continued to source funding for operating expenses, social benefits to households, and health and transport infrastructure projects. 

  1. "Other" includes gold and special drawing rights, currency, bills of exchange, derivatives, shares and equity, unfunded superannuation and accounts payable/receivable.

Capital investment

Figures in the capital investment section are in seasonally adjusted current prices.

Net lending (+) / borrowing (-)

Australia's net borrowing position rose by $0.9b to $16.8b this quarter.

This was driven by a:

  • $5.9b increase in gross fixed capital formation
  • $0.4b increase in acquisitions less disposals of non-produced non-financial assets                                                                

and was partly offset by a:

  • $1.3b increase in net savings
  • $0.5b decrease in change in inventories

National net borrowing as a proportion of GDP increased slightly this quarter, driven by an increase in gross fixed capital formation.

  • Financial corporations' net lending decreased by $6.7b to $5.3b.
  • Non-financial corporations' net borrowing increased by $1.7b to $13.8b.      
  • General government net borrowing increased by $10.4b to $36.7b.             
  • Households' net lending increased by $10.4b to $25.9b.                                     

Notable drivers included the following: 

  • Financial corporations' net lending was driven by a decrease in net savings due to a decrease in dividends receivable.
  • Non-financial corporations' net borrowing was driven by an increase in gross fixed capital formation from both private non-financial corporations and public non-financial corporations.
  • General government net borrowing was driven by a decrease in net capital transfers from national general government due to an increase in capital transfers payable to households.
  • Households' net lending was driven by an increase in net capital transfers due to an increase in capital transfers received from general government.
     

Capital Investment

National capital investment increased to 24.5% as a proportion of GDP, while increasing 3.5% in current price seasonally adjusted terms. 

Relative to GDP: 

  • Household capital investment rose to 8.1%
  • Non-financial corporations' capital investment rose to 12.1%
  • Financial corporations' capital investment remained at 0.6%
  • General government capital investment remained at 3.8%

In current price seasonally adjusted terms:

  • Non-financial corporations' capital investment rose, driven by an increase in both private non-financial corporations and public non-financial corporations.
  • General government capital investment rose, driven by an increase in both national general government and state and local general government. 

Data downloads

Time series spreadsheets

Data files

Previous catalogue number

This release previously used catalogue number 5232.0

Revisions and changes

Revisions in this issue

There have been revisions to previously published aggregates after September quarter 2023. These revisions are due to quality assurance reviews and amendments to data collected in the ABS Survey of Financial Information, ABS Survey of International Investment and to data derived from Australian Prudential Regulation Authority (APRA) administrative data sets.

Cessation of selected Survey of Financial Information (SFI) collections

From the September quarter 2025, the Survey of Financial Information for private non-financial corporations and life offices and friendly societies sectors has ceased. Financial data for these sectors is now being compiled using alternative sources and methods, including other ABS data collections and administrative sources, such as:

  • APRA financial sector administrative data
  • Australian Securities Exchange (ASX) administrative data
  • ABS Business Indicators, Australia
  • ABS Government Finance Statistics, Australia
  • ABS Survey of International Investment

AASB 17 accounting standard

The adoption of the AASB 17 accounting standard by the insurance industry has resulted in changes to source data reporting. Consequently, some of the estimates for life insurance corporations since the September quarter 2023 have been modelled. While these series continue to be published, users are advised to apply caution.

ABS Managed Funds publication

Consultation with users and industry in late 2023 found that the Managed Funds publication and underlying collections no longer aligned with the way the industry operates and did not capture the full scope of activity. As a result, the Managed Funds publication was paused following the release of the December quarter 2023 issue.
 
The ABS is currently working with key stakeholders to improve the quality of our managed funds statistics. 
 
ABS survey data on public offer unit trusts will continue to be used in the compilation of associated sectors in the National Accounts: Finance and Wealth publication (tables 9 and 23). In this publication, adjustments are made to these sectors to account for scope and coverage, based on other counterparty information, though some underlying quality issues remain. Users are advised to apply caution when using these statistics and use the methodology and data quality notes when referencing any data points. For additional information please see the December quarter 2023 Managed Funds publication.

Back to top of the page