MANUFACTURING
Definition and scope
In a broad sense manufacturing activity relates to the physical or chemical transformation of materials or components into new products, whether the work is performed by power driven machines or by hand.
ANZSIC Division C, Manufacturing, consists of nine sub-divisions:
- Food, beverage and tobacco manufacturing (sub-division 21)
- Textile, clothing, footwear and leather manufacturing (sub-division 22)
- Wood and paper product manufacturing (sub-division 23)
- Printing, publishing and recorded media (sub-division 24)
- Petroleum, coal, chemical and associated product manufacturing (sub-division 25)
- Non-metallic mineral product manufacturing (sub-division 26)
- Metal product manufacturing (sub-division 27)
- Machinery and equipment manufacturing (sub-division 28)
- Other manufacturing (sub-division 29).
Summary of GSP(P) sources and methods
The methodology for Manufacturing uses an output indicator approach to compile state by industry GVA estimates. Manufacturing output volumes are derived by deflating sales estimates for the various manufacturing activities at a sub-division level. The output indicators form the basis upon which volume measures of value added are derived at the division level.
The current price state estimates of Manufacturing output are obtained from the annual ABS Manufacturing Industry, Australia (cat. no. 8221.0) for all but the latest two years. Since the survey is released approximately two years after the reference period, QBIS data are used to extrapolate the current price Manufacturing output data for the latest two years. Therefore, estimates for the most recent two years have the potential to be subject to considerable revision when the Manufacturing Survey data become available.
The current price output estimates are price deflated using Manufacturing sub-division price indexes, obtained from ABS PPI. National level price indexes are used as no state level indexes are available.
This method is used for each Manufacturing sub-division except for 'Petroleum, coal, chemical and associated product manufacturing' which is quantity revalued using quantities of automotive gasoline, aviation turbine and automotive diesel obtained from the Department of Industry, Tourism and Resources (DITR) publication Australian Petroleum Statistics. The volume estimates of output by Manufacturing sub-division for each state are then summed to the Manufacturing division level.
The state output indicators are used to derive volume measures of GVA for Manufacturing. The state volume GVAs are benchmarked to the annual national industry volume GVA.
Results for Manufacturing
Manufacturing gross value added(a), Chain volume measures(b) |
|  |
 | 2000-01 | 2001-02 | 2002-03 | 2003-04 | 2004-05 | 2005-06 |  |
Values ($m) |  |
|  |
| New South Wales | 31 674 | 32 106 | 32 931 | 32 875 | 32 224 | 31 989 |  |
| Victoria | 30 699 | 30 423 | 30 751 | 30 377 | 29 365 | 28 453 |  |
| Queensland | 12 381 | 13 109 | 13 948 | 14 381 | 14 612 | 15 106 |  |
| South Australia | 7 917 | 8 006 | 8 285 | 8 413 | 8 409 | 8 422 |  |
| Western Australia | 6 095 | 6 731 | 7 544 | 8 102 | 8 380 | 8 610 |  |
| Tasmania | 2 184 | 2 102 | 2 151 | 2 223 | 2 298 | 2 399 |  |
| Northern Territory | 563 | 634 | 712 | 739 | 705 | 630 |  |
| Australian Capital Territory | 284 | 304 | 329 | 350 | 373 | 402 |  |
| Australia | 91 195 | 93 133 | 96 528 | 97 422 | 96 366 | 96 012 |  |
Percentage changes from previous year (%) |  |
|  |
| New South Wales | 2.0 | 1.4 | 2.6 | -0.2 | -2.0 | -0.7 |  |
| Victoria | -0.5 | -0.9 | 1.1 | -1.2 | -3.3 | -3.1 |  |
| Queensland | 6.6 | 5.9 | 6.4 | 3.1 | 1.6 | 3.4 |  |
| South Australia | 1.4 | 1.1 | 3.5 | 1.5 | - | 0.1 |  |
| Western Australia | 8.2 | 10.4 | 12.1 | 7.4 | 3.4 | 2.8 |  |
| Tasmania | -5.7 | -3.8 | 2.3 | 3.4 | 3.4 | 4.4 |  |
| Northern Territory | 10.1 | 12.6 | 12.2 | 3.8 | -4.5 | -10.6 |  |
| Australian Capital Territory | 8.6 | 6.8 | 8.2 | 6.6 | 6.4 | 7.7 |  |
| Australia | 2.2 | 2.1 | 3.6 | 0.9 | -1.1 | -0.4 |  |
|  |
| - nil or rounded to zero (including null cells) |
| (a) At basic prices. |
| (b) Reference year for chain volume measures is 2004-05. |
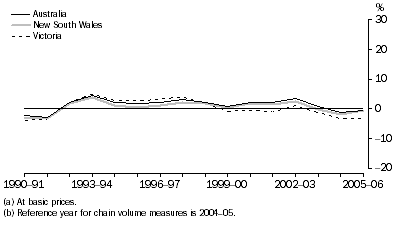
Manufacturing gross value added(a), Chain volume measures(b)-Percentage changes

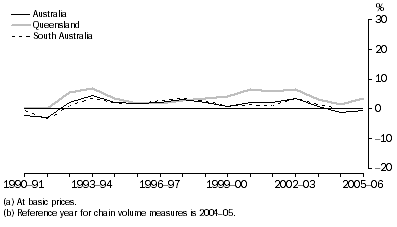
Manufacturing gross value added(a), Chain volume measures(b)-Percentage changes

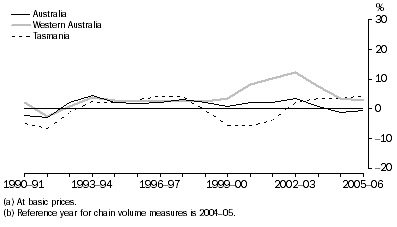
Manufacturing gross value added(a), Chain volume measures(b)-Percentage changes

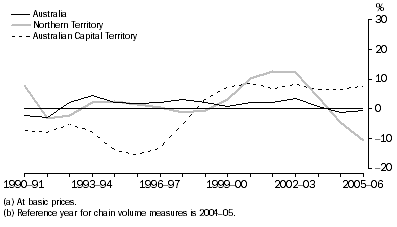
Manufacturing gross value added(a), Chain volume measures(b)-Percentage changes

Throughout the time series, New South Wales, Victoria, Queensland and South Australia have exhibited a similar growth pattern to the overall Australia series, while Western Australia, Tasmania and the Northern Territory followed the Australian pattern until 1998-99 and then diverged. Queensland recorded positive Manufacturing growth throughout the time series with a peak recorded in 1993-94.
Manufacturing gross value added, State shares - Current prices |
|  |
 | 1989-90 | 1994-95 | 1999-00 | 2003-04 | 2004-05 | 2005-06 |  |
 | % | % | % | % | % | % |  |
|  |
| New South Wales | 32.1 | 33.8 | 34.3 | 33.6 | 33.4 | 33.1 |  |
| Victoria | 33.4 | 32.0 | 31.3 | 30.5 | 30.5 | 30.0 |  |
| Queensland | 12.3 | 13.7 | 13.8 | 14.8 | 15.2 | 15.5 |  |
| South Australia | 10.0 | 9.1 | 8.5 | 8.9 | 8.7 | 8.9 |  |
| Western Australia | 8.6 | 8.0 | 8.9 | 8.6 | 8.7 | 9.0 |  |
| Tasmania | 2.6 | 2.3 | 2.3 | 2.4 | 2.4 | 2.4 |  |
| Northern Territory | 0.6 | 0.7 | 0.7 | 0.8 | 0.7 | 0.7 |  |
| Australian Capital Territory | 0.4 | 0.4 | 0.3 | 0.4 | 0.4 | 0.4 |  |
| Australia | 100.0 | 100.0 | 100.0 | 100.0 | 100.0 | 100.0 |  |
|  |
The Australian Manufacturing industry is dominated by New South Wales and Victoria which together accounted for 63.1% of Australian Manufacturing GVA in 2005-06. New South Wales has slightly increased its share from 32.1% in 1989-90 to 33.1% in 2005-06 but the share has been stable at around 33% for most of the time series. Victoria and South Australia have decreased their shares throughout the time series. Victoria's share went from 33.4% to 30.0% and South Australia went from 10.0% to 8.9%. Queensland has gradually increased its share throughout the time series from 12.3% in 1989-90 to 15.5% in 2005-06. The other states shares have remained stable.
 Print Page
 Print All