CONSTRUCTION
Definition and scope
The Construction industry includes all units mainly engaged in constructing buildings, roads, railroads, aerodromes, irrigation projects, harbour or river works, water, gas, sewerage or stormwater drains or mains, electricity or other transmission lines or towers, pipelines, oil refineries or other specified civil engineering projects. Units mainly engaged in the repair of buildings or of other structures are also included as are those engaged in the alteration or renovation of buildings, preparation of mine sites, demolition and excavation.
ANZSIC Division E, Construction, consists of two sub-divisions:
- General construction (sub-division 41)
- Construction trade services (sub-division 42).
Summary of GSP(P) sources and methods
The methodology for Construction uses an output indicator approach to compile state by industry GVA estimates. Construction output volumes are derived by the price deflation method.
An output indicator method is used to construct volume measures of the value of work done for residential house construction, alterations and additions to dwellings, non-house dwelling construction, non-dwelling building and non-building construction.The current price output estimates are sourced from the ABS, Building Activity, Australia (BACS) (cat. no. 8752.0), and Engineering Construction Activity, Australia (cat. no. 8762.0), at a detailed level.
The state deflators for residential house construction and alterations and additions to dwellings are sourced from the ABS collection, House Price Index, Eight Capital Cities (cat. no. 6416.0), specifically the state project home price index. Other dwelling price index and non-dwelling building price indexes are sourced from the ABS PPI. Non-building construction national deflators are constructed by the ABS using the activity and work done, and are applied to states as no separate state level indexes are available.
The current price and deflator data are used to derive state output volume estimates. The output volumes are weighted together using interpolated value added data from the ABS 1988-89 and 2002-03 Private Sector Construction Industry, Australia (cat. no.s 8771.0 and 8772.0 respectively). The resultant estimates are then summed to division level to derive output volume estimates.
The state output volume indicators are used to derive volume measures of GVA for Construction. The state volume GVAs are benchmarked to the annual national industry volume GVA.
Results for Construction
Construction gross value added(a), Chain volume measures(b) |
|  |
| 2000-01 | 2001-02 | 2002-03 | 2003-04 | 2004-05 | 2005-06 | |
Values ($m) | |
| |
| New South Wales | 13 883 | 15 433 | 17 984 | 19 044 | 19 883 | 20 806 | |
| Victoria | 8 615 | 9 732 | 11 153 | 12 057 | 12 550 | 13 241 | |
| Queensland | 8 094 | 8 907 | 10 215 | 11 062 | 11 625 | 12 784 | |
| South Australia | 2 278 | 2 520 | 3 008 | 3 191 | 3 359 | 3 475 | |
| Western Australia | 4 466 | 5 066 | 6 171 | 6 353 | 6 740 | 8 287 | |
| Tasmania | 504 | 628 | 629 | 739 | 763 | 856 | |
| Northern Territory | 443 | 564 | 665 | 720 | 791 | 780 | |
| Australian Capital Territory | 855 | 962 | 1 162 | 1 189 | 1 229 | 1 414 | |
| Australia | 39 106 | 43 777 | 50 973 | 54 353 | 56 940 | 61 644 | |
Percentage changes from previous year (%) | |
| |
| New South Wales | -16.1 | 11.2 | 16.5 | 5.9 | 4.4 | 4.6 | |
| Victoria | -12.8 | 13.0 | 14.6 | 8.1 | 4.1 | 5.5 | |
| Queensland | -11.1 | 10.0 | 14.7 | 8.3 | 5.1 | 10.0 | |
| South Australia | -12.6 | 10.7 | 19.4 | 6.1 | 5.3 | 3.5 | |
| Western Australia | -13.4 | 13.4 | 21.8 | 3.0 | 6.1 | 23.0 | |
| Tasmania | -10.2 | 24.5 | 0.2 | 17.5 | 3.3 | 12.1 | |
| Northern Territory | -15.1 | 27.3 | 17.9 | 8.3 | 9.8 | -1.3 | |
| Australian Capital Territory | -20.3 | 12.6 | 20.7 | 2.4 | 3.4 | 15.0 | |
| Australia | -13.9 | 11.9 | 16.4 | 6.6 | 4.8 | 8.3 | |
| |
| (a) At basic prices. |
| (b) Reference year for chain volume measures is 2004-05. |
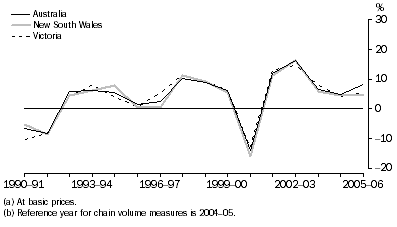
Construction gross value added(a), Chain volume measures(b)-Percentage changes
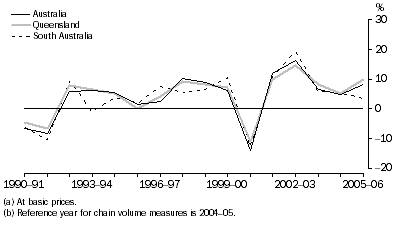
Construction gross value added(a), Chain volume measures(b)-Percentage changes
Construction gross value added(a), Chain volume measures(b)-Percentage changes

Construction gross value added(a), Chain volume measures(b)-Percentage changes
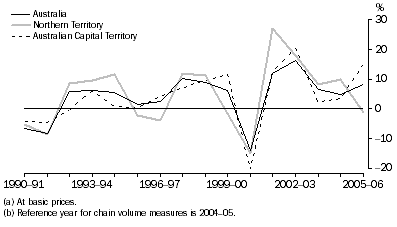
Construction industry growth rates for the states have generally followed that of Australia, except for Tasmania, since 2002-03. Reflecting continuous positive growth in the national level of Construction value added since 2001-02, all states, except for the Northern Territory, recorded positive value added growth in 2005-06.
A large amount of construction work was brought forward into 1999-2000 preceding the introduction of the GST. This resulted in a large decline in the Construction industry across all states in 2000-01. This was followed by two years of strong growth across all states except Tasmania, which only increased by 0.2% in 2002-03. The unusual growth in Tasmania in 2001-02 and 2003-04 compared to other states and Australia is due to the Devonport natural gas pipeline project which strongly increased the building and engineering construction in these years. In 2005-06, Western Australia (23.0%), the Australian Capital Territory (15.0%), Tasmania (12.1%), and Queensland (10.0%) all had growth rates above the national growth of 8.3%.
Construction gross value added, State shares - Current prices |
| |
| 1989-90 | 1994-95 | 1999-00 | 2003-04 | 2004-05 | 2005-06 | |
| % | % | % | % | % | % | |
| |
| New South Wales | 33.0 | 35.5 | 36.7 | 35.2 | 34.9 | 31.8 | |
| Victoria | 25.5 | 20.7 | 21.5 | 22.4 | 22.0 | 21.9 | |
| Queensland | 17.8 | 19.2 | 19.2 | 20.2 | 20.4 | 21.5 | |
| South Australia | 7.5 | 6.6 | 6.0 | 5.9 | 5.9 | 5.4 | |
| Western Australia | 11.5 | 12.4 | 12.0 | 11.5 | 11.8 | 14.3 | |
| Tasmania | 1.8 | 2.1 | 1.2 | 1.3 | 1.3 | 1.4 | |
| Northern Territory | 1.2 | 1.2 | 1.1 | 1.4 | 1.4 | 1.3 | |
| Australian Capital Territory | 1.8 | 2.2 | 2.3 | 2.1 | 2.2 | 2.3 | |
| Australia | 100.0 | 100.0 | 100.0 | 100.0 | 100.0 | 100.0 | |
| |
New South Wales, Victoria and Queensland together accounted for around 75% of Australian Construction GVA in 2005-06. From 1989-90 to 2005-06, New South Wales share fell from 33.0% to 31.8%, although during this time its share peaked in 1999-2000 at 36.7%. Victoria fell from 25.5% in 1989-90 to 21.9% in 2005-06. Queensland, Western Australia and the Australian Capital Territory have had increased shares while the Tasmanian and Northern Territory shares have remained relatively stable.
 Print Page
 Print All