MARCH KEY FIGURES
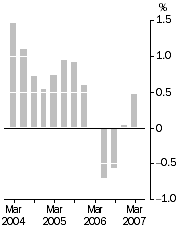
Inventories (volume terms), Trend estimates - Quarterly change
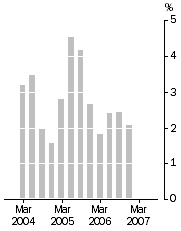
| Company gross operating profits (current prices), Trend estimates - Quarterly change
|
MARCH KEY POINTS
TELSTRA PRIVATISATION
- Many key data items have been impacted by the privatisation of Telstra. See changes in this issue.
CHAIN VOLUME ESTIMATES
- The trend estimate for inventories increased 0.5% in the March quarter 2007. The seasonally adjusted estimate increased 1.4% with all industries increasing this quarter. Mining and Retail were the largest contributors to the increase.
- The seasonally adjusted estimate for Manufacturing sales of goods and services increased 1.3% this quarter.
- The trend estimate for Wholesale trade's sales of goods and services increased 1.3% this quarter. The seasonally adjusted estimate increased 1.5% following a similar rate of growth in the previous quarter.
CURRENT PRICE ESTIMATES
- The seasonally adjusted estimate for company gross operating profits increased 7.6% in the March quarter 2007.
- The seasonally adjusted estimate for wages and salaries increased 3.4% this quarter.
NOTES
FORTHCOMING ISSUES
| ISSUE (QUARTER) | Release Date |
| June 2007 | 3 September 2007 |
| September 2007 | 3 December 2007 |
COMPARISON BETWEEN COMPANY GROSS OPERATING PROFITS AND GROSS OPERATING SURPLUS
Price changes have had an impact on the value of inventories held by Australian businesses this quarter. An inventories valuation adjustment (IVA) is applied in the calculation of the gross operating surplus of private non-financial corporations (GOS) estimate in the Australian National Accounts. As prices for inventories have fallen in the March quarter, growth in GOS will be higher after the application of the IVA. The IVA for the March quarter is -$379m which is $847m lower than December quarter IVA of $468m. No adjustment is made to the company gross operating profits (CGOP) estimate in this publication and, as a result, users should exercise caution when comparing the two series. It should be noted that there are other differences between the two series. In particular, changes are made to GOS when annual benchmarks are applied and slightly different seasonal factors apply to the two series. Given this, while CGOP movements are an appropriate indicator for GOS, it is not the case that the two series will have equivalent seasonally adjusted movements from quarter to quarter.
FORTHCOMING CHANGES
A new reference year is typically updated annually every June quarter. From 2007 onwards the updating of the reference year will be completed in the September quarter each year. In September 2007 the new reference year will be 2005-06 for chain volume estimates. This will result in revisions to growth rates in quarters following 2005-06 but will preserve additivity in those quarters. For earlier periods re-referencing affects the levels of, but not the movements in, chain volume estimates.
INQUIRIES
For further information about these and related statistics, contact the National Information and Referral Service on 1300 135 070 or Fiona Cotsell on Sydney (02) 9268 4241.
 Print Page
 Print All